Crypto Market Indicators - Part 5: The Versatile Technical Indicators!
Disclaimer: Nothing in this post should be taken as financial advice. Trading involves risk, and you are solely responsible for your own decisions and potential losses.
1 Introduction
This is part 5 in my Crypto Market Indicators series, loosely related to
Closely related to
- Part 3: US Dollar Index and Bitcoin Dominance
- Part 4: Pi Cycle Top and MVRV Z-score
- Part 6: Indicator Cheat Sheet
as they are all outcomes of the same research effort.
In this series, I follow a top-down hierarchy to discuss indicators. While Part 3 discussed global macro and crypto indicators, Part 4 focused on Bitcoin (BTC) related ones, and this one will explore technical indicators, which are versatile enough to be applied from very high-level charts to intra-day trading and everything in between.
2 Technical indicators
Technical indicators are not specific to any market or chart. They are generic tools that can be applied to different charts to help you interpret them. They also have parameters that you can change to tailor them for your needs. They work because their values are derived from the underlying market mechanics, which in turn are driven by trading psychology (you can read more about this in my Smart Money Concepts post). There is also a self fulfilling prophecy aspect to them. This is especially true if you use the most common settings, which are watched by everyone. Therefore, in my opinion, when it comes to technical indicators, the simpler and more obvious they are, the better.
2.1 Relative Strength Index (RSI)
The RSI is a simple momentum gauge whose values fall between 0 and 100. It shines in sideways markets. The most common parameter settings are a length of 14 with an undervalued threshold of 30 and an overvalued threshold of 70. You can visit Investopedia for further reading.
2.1.1 On the monthly
On the monthly chart, RSI has been a good indicator of tops and bottoms (see Figure 1 and Figure 2) with the following parameters:
- Length: 14
- Overvalued: 80-90 range: top signal
- Undervalued: 40-50 range: bottom signal
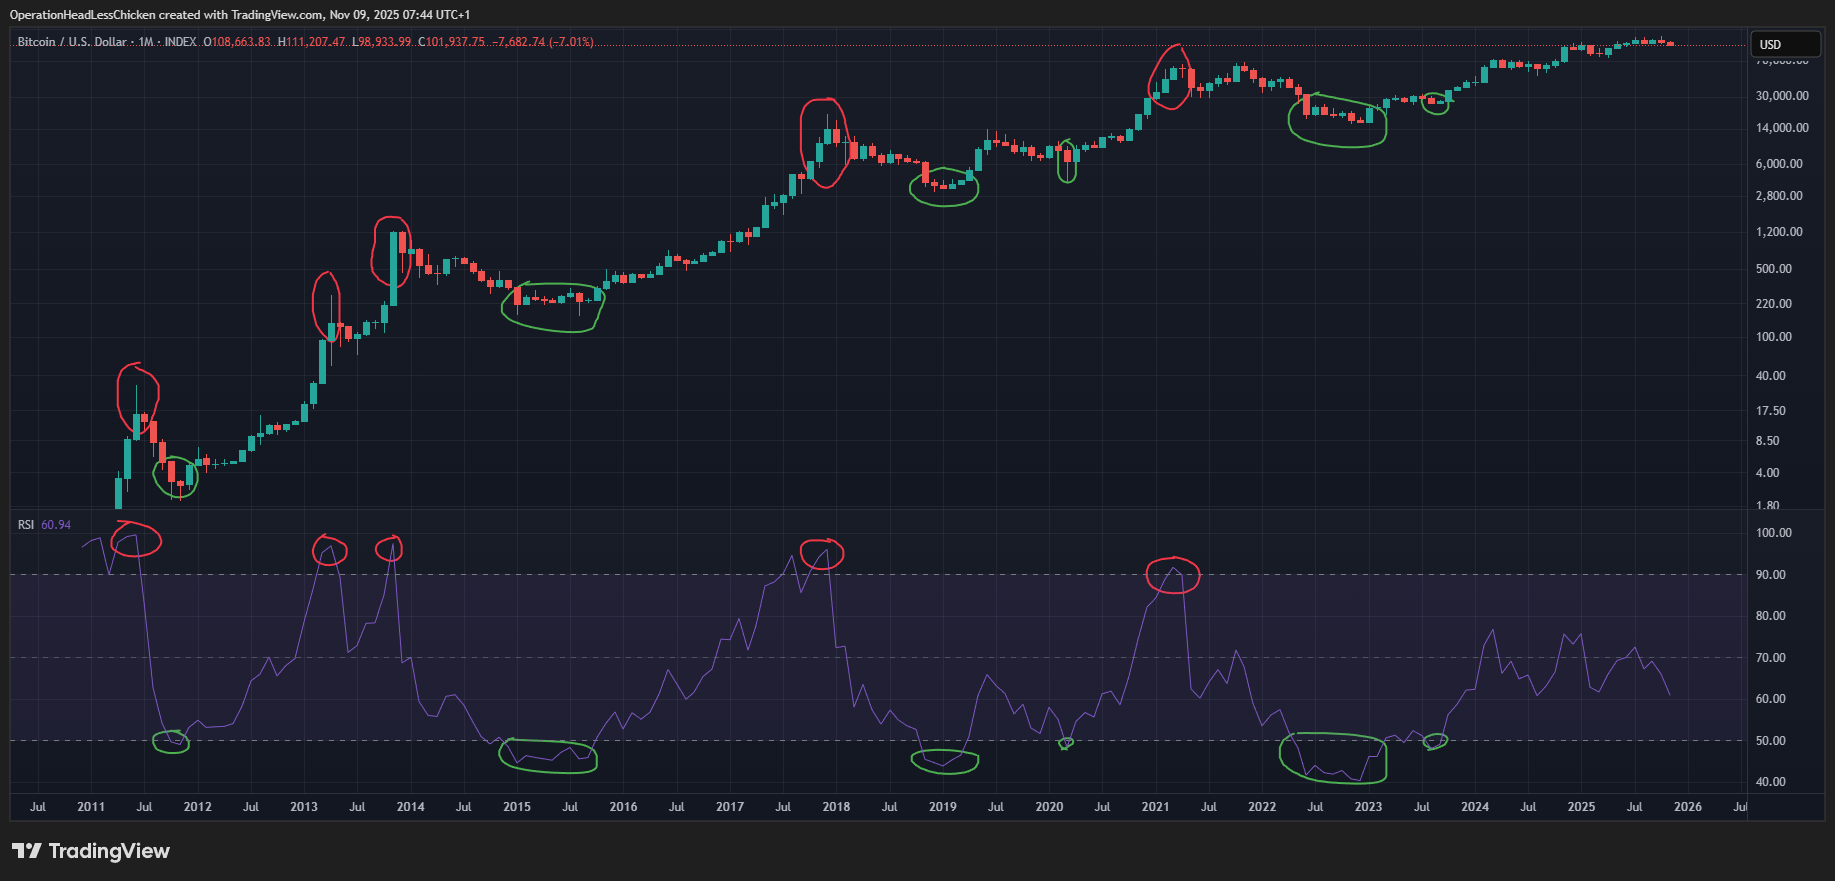
Figure 1: BTC monthly with RSI top and bottom signals
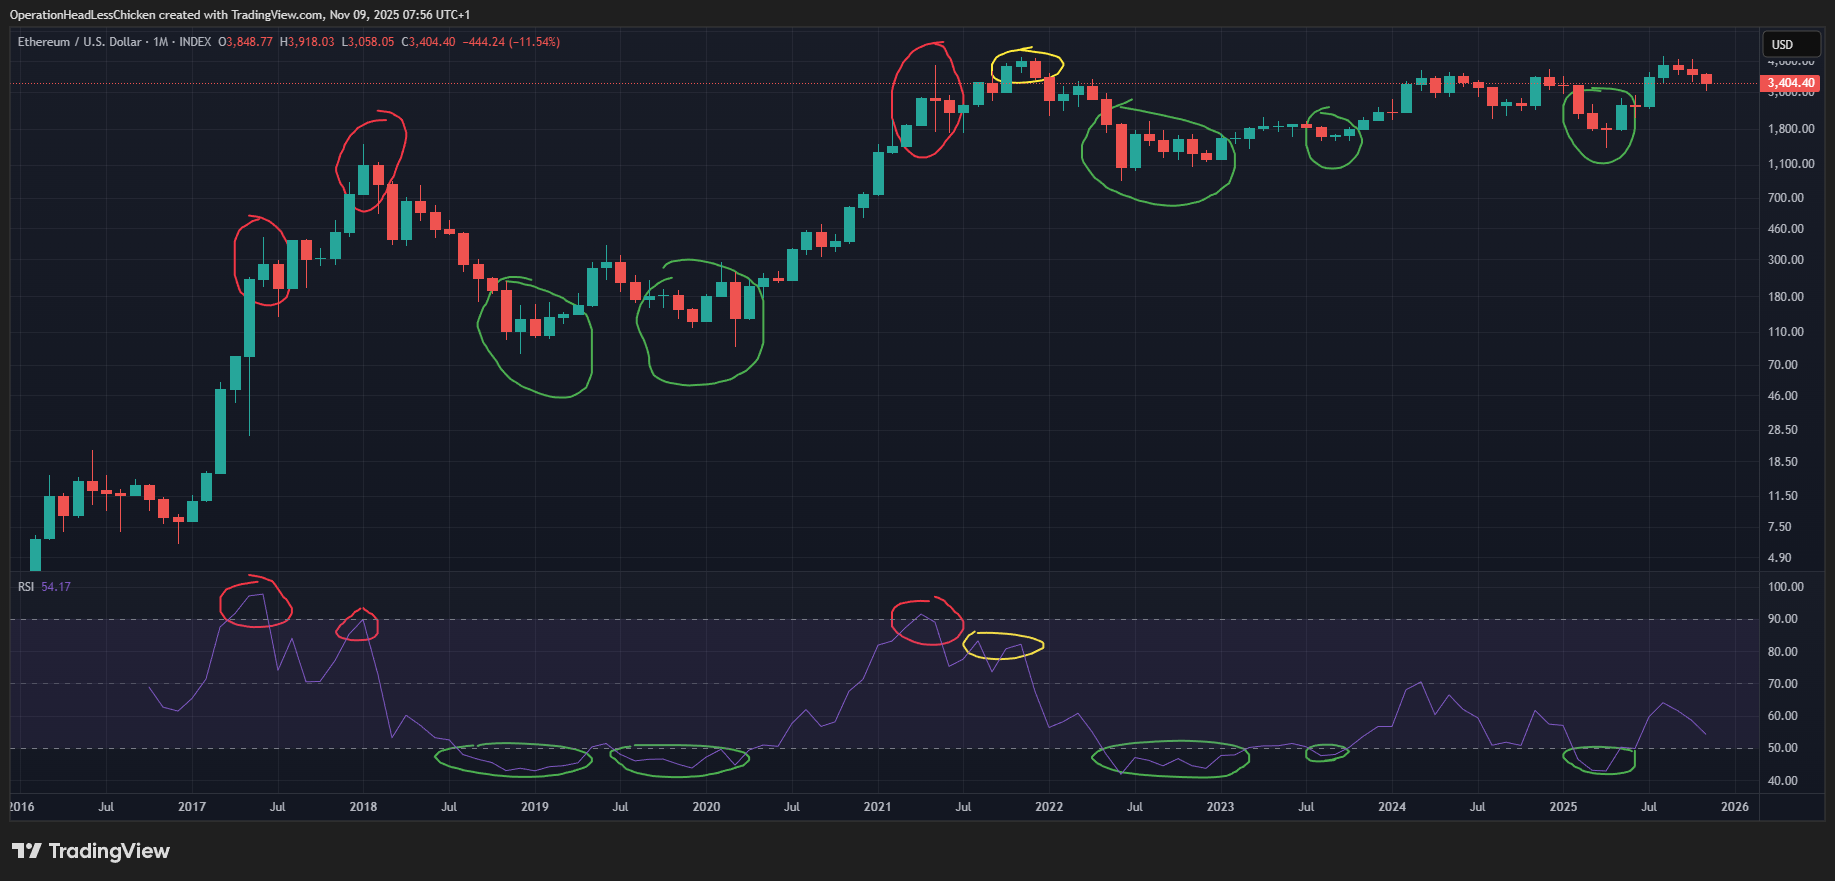
Figure 2: Ethereum (ETH) monthly with RSI top and bottom signals
In the pictures above, I set the RSI upper band to 90, and the lower band to 50. As you can see, these settings produced pretty good quality signals, with the only caveat on ETH’s chart marked with a yellow circle, which was the real top, but didn’t reach 90 on the RSI. However, it was within the 80-90 range I mentioned above.
2.2 20-period Simple Moving Average (MA)
Note: The guys at Coin Bureau, whose videos were my main source for this article, use the Bollinger Bands (BB) Moving Average for this purpose, but it really is just a 20-period Simple Moving Average (MA), so I use the latter instead to keep the charts cleaner.
Note 2: Some people (including me) like to use period 21 instead of 20 for their moving averages because 21 is a Fibonacci number. However, the difference between the two is not significant. In this article I will stick to period 20 moving averages.
2.2.1 On the monthly
The 20-month MA can help you decide if the given chart is in a bull or bear market. It can be applied to different charts, see below:
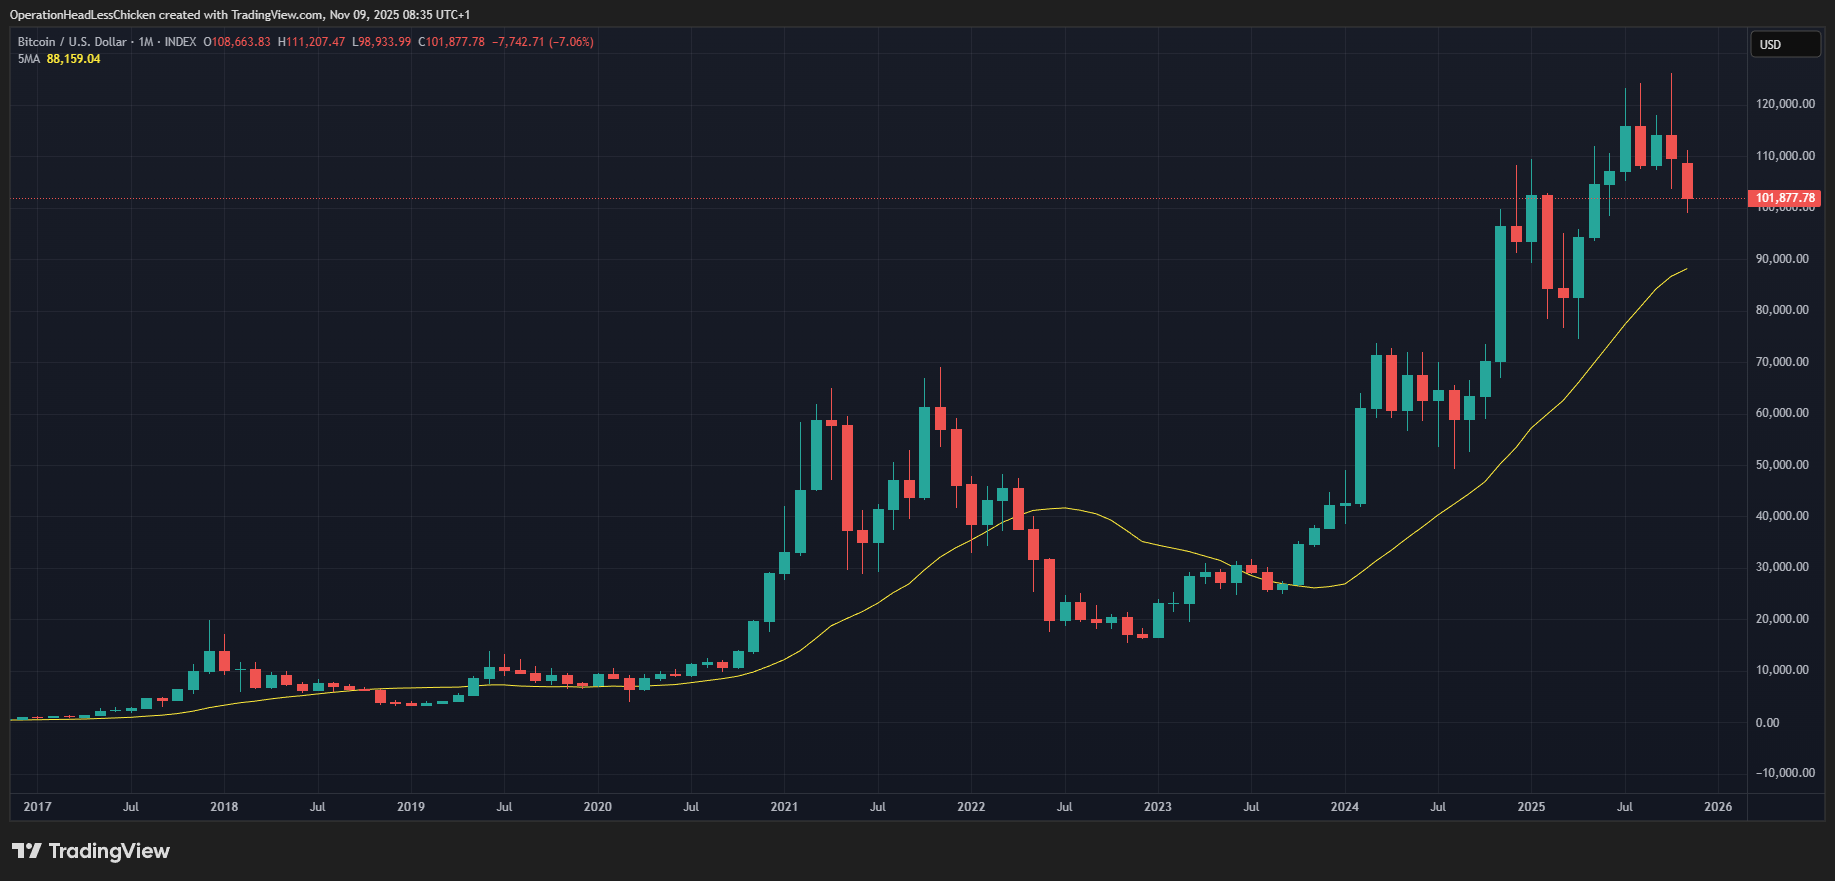
Figure 3: BTC and 20-MA, monthly
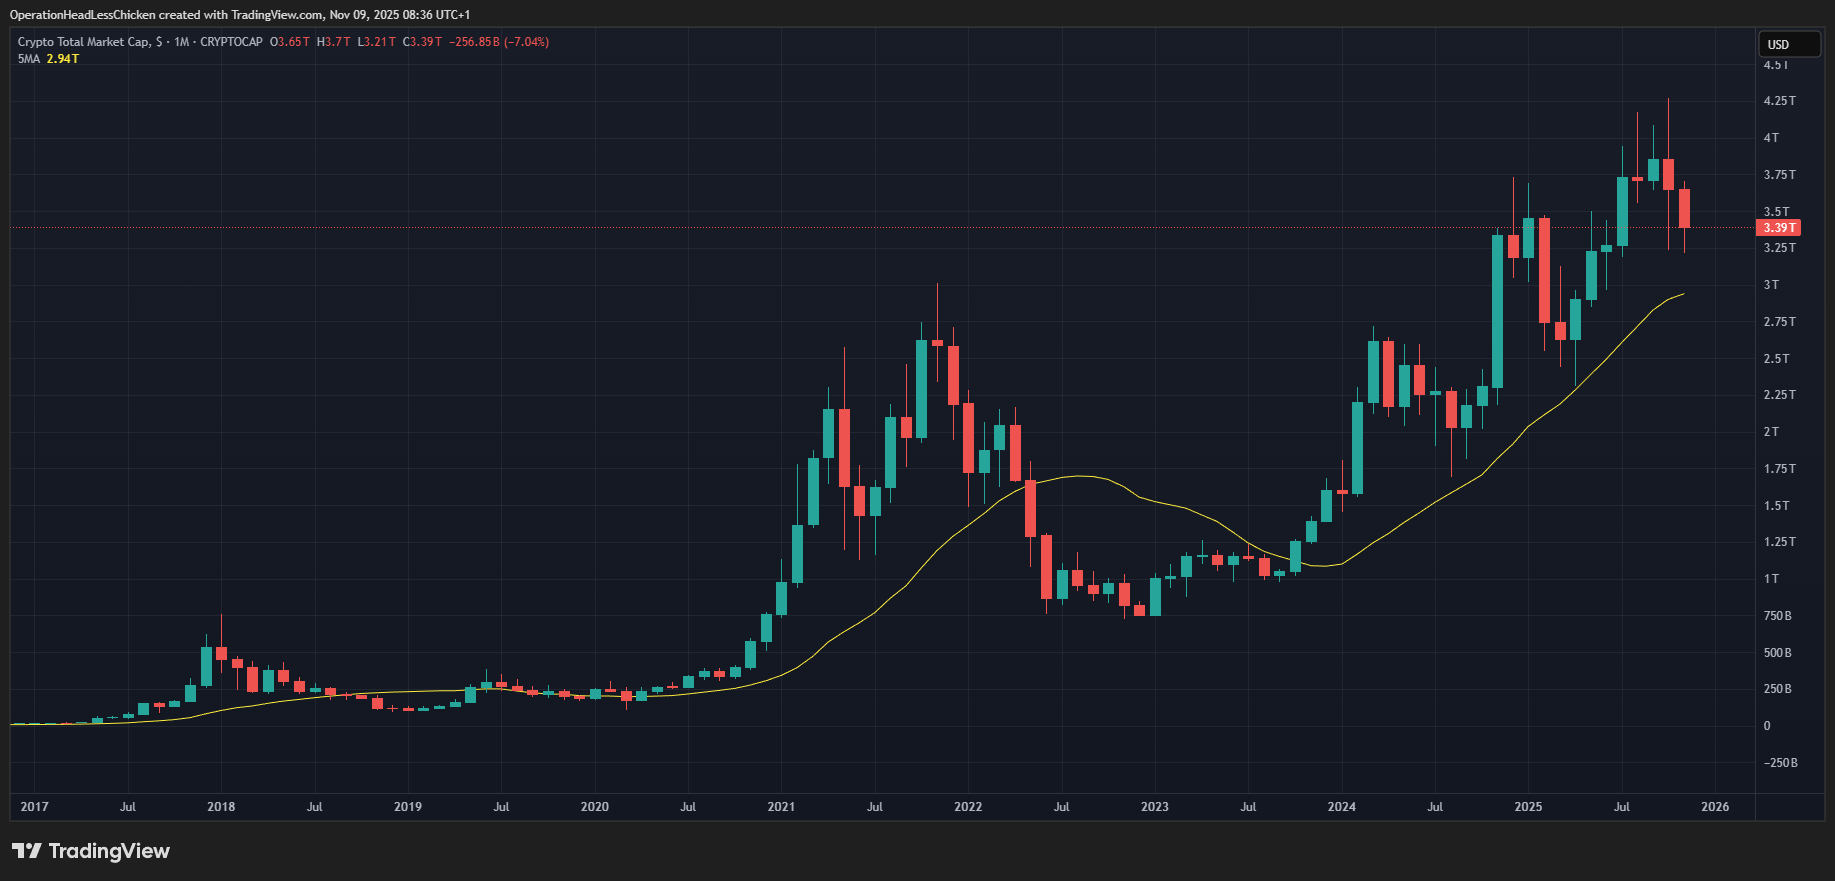
Figure 4: TOTAL and 20-MA, monthly
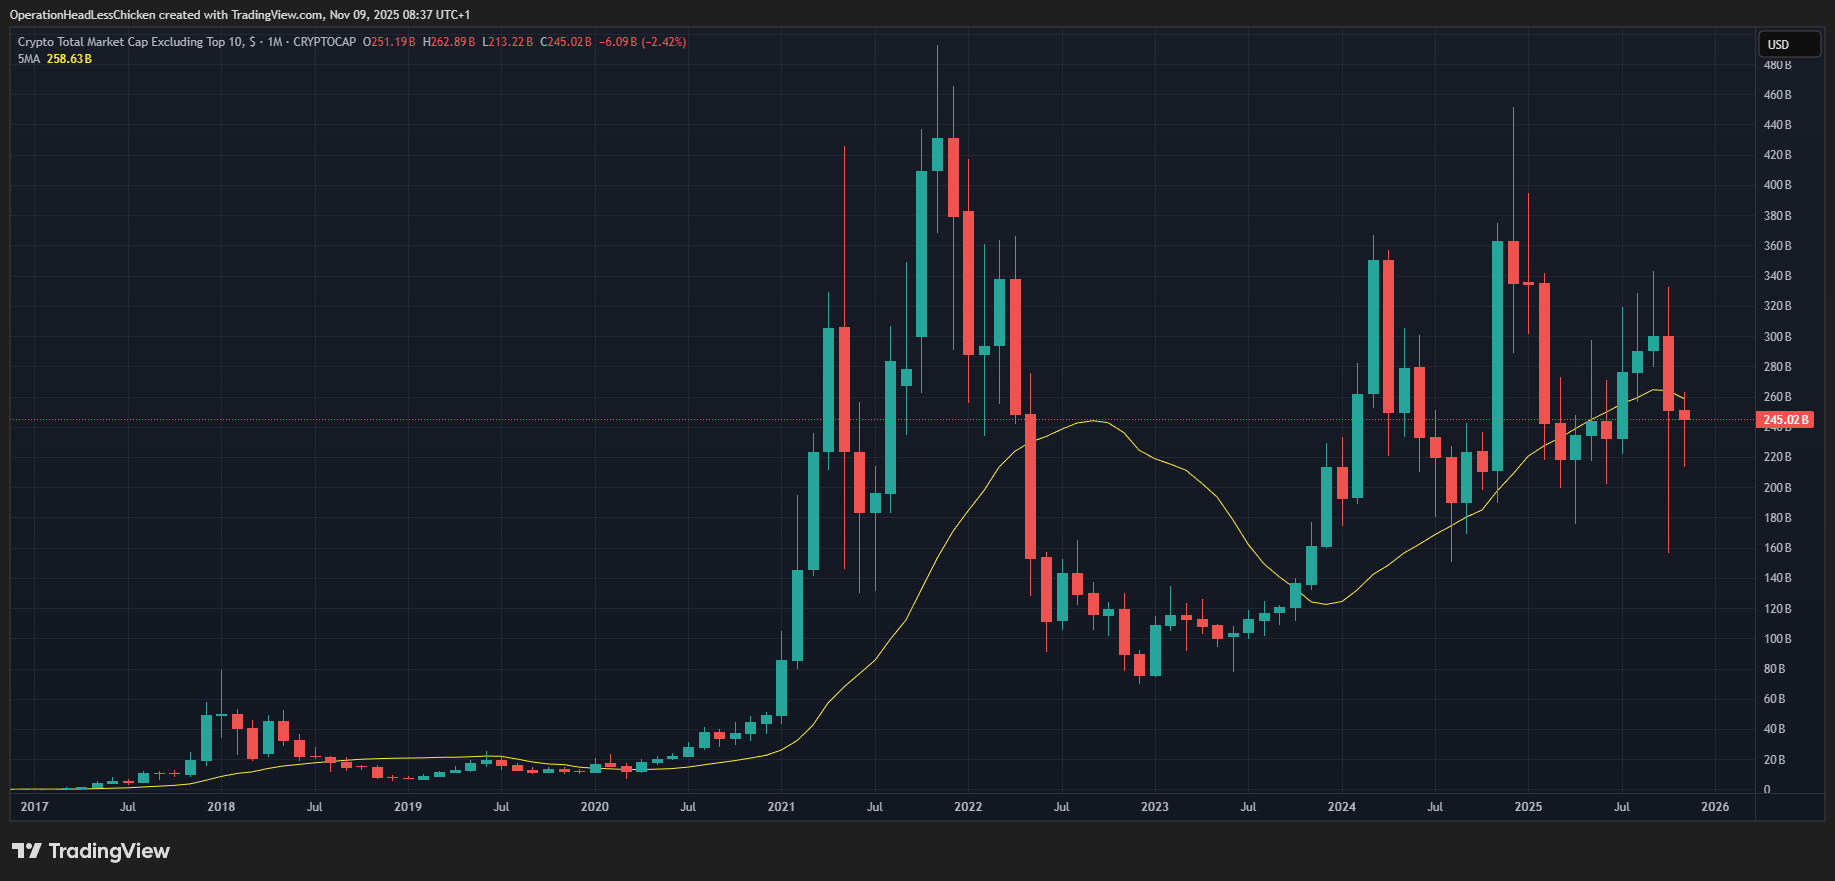
Figure 5: OTHERS and 20-MA, monthly
When the chart is above its 20-month MA, it is in bull market territory, when it is below it, it is in bear market territory. As you can see, BTC (Figure 3) and TOTAL (Figure 4) (which are strongly correlated charts) are well above their MAs. For example, BTC is at 101,877, while its MA is at 88,159. This means, that a pullback to around 88k by BTC would still be technically in a bull market.
On the other hand (pun intended), OTHERS (Figure 5) at 245 B USD, is struggling with its MA at 258.64 B USD. It is technically in bear market territory, which is not good news for alts. It has seen massive wicks under the MA, and in November it is still under it, however, in my opinion, it doesn’t look hopeless.
2.2.2 On the weekly
Although the 20-month MA is a reliable way to tell if your crypto is in a bull or bear market, it comes with the cost of significant latency. MAs are already lagging indicators, let alone on the monthly chart, which means that by the time your crypto closes below its 20-month MA, it has already dropped significantly. We can improve this by using the 20 MA on the weekly chart and combining it with the aforementioned RSI:
- If the RSI on the monthly has hit the 80-90 overbought territory, and
- A key level breaks on the weekly chart, such as the 20 MA, the top is likely in, the bear market is about to start.
Question: Why don’t we simply sell, when RSI hits the 80-90 level on the monthly?
Answer: because the RSI can stay in the overbought territory for quite a while. If you sell as soon as it signals overbought, it may be too early, and the price may keep climbing up. Possible solutions to mitigate this problem:
Dollar Cost Average (DCA)out: don’t close the whole position at once, but take profits gradually. It is almost always a good idea- Sell, when the RSI pulls back to neutral territory: again, this could be a bit late, if you look only at the monthly chart
- Check signals on the lower timeframe, like the
20-week MA, as we are discussing here
Let’s take a look at BTC’s 2021 peak marked with a red circle in Figure 6. It is the last time when RSI went above 90, the first peak of the 2021 double top. Had you waited until the monthly close below the 20-month MA, you would have sold at 37,648 USD (see price label), 13 months later!
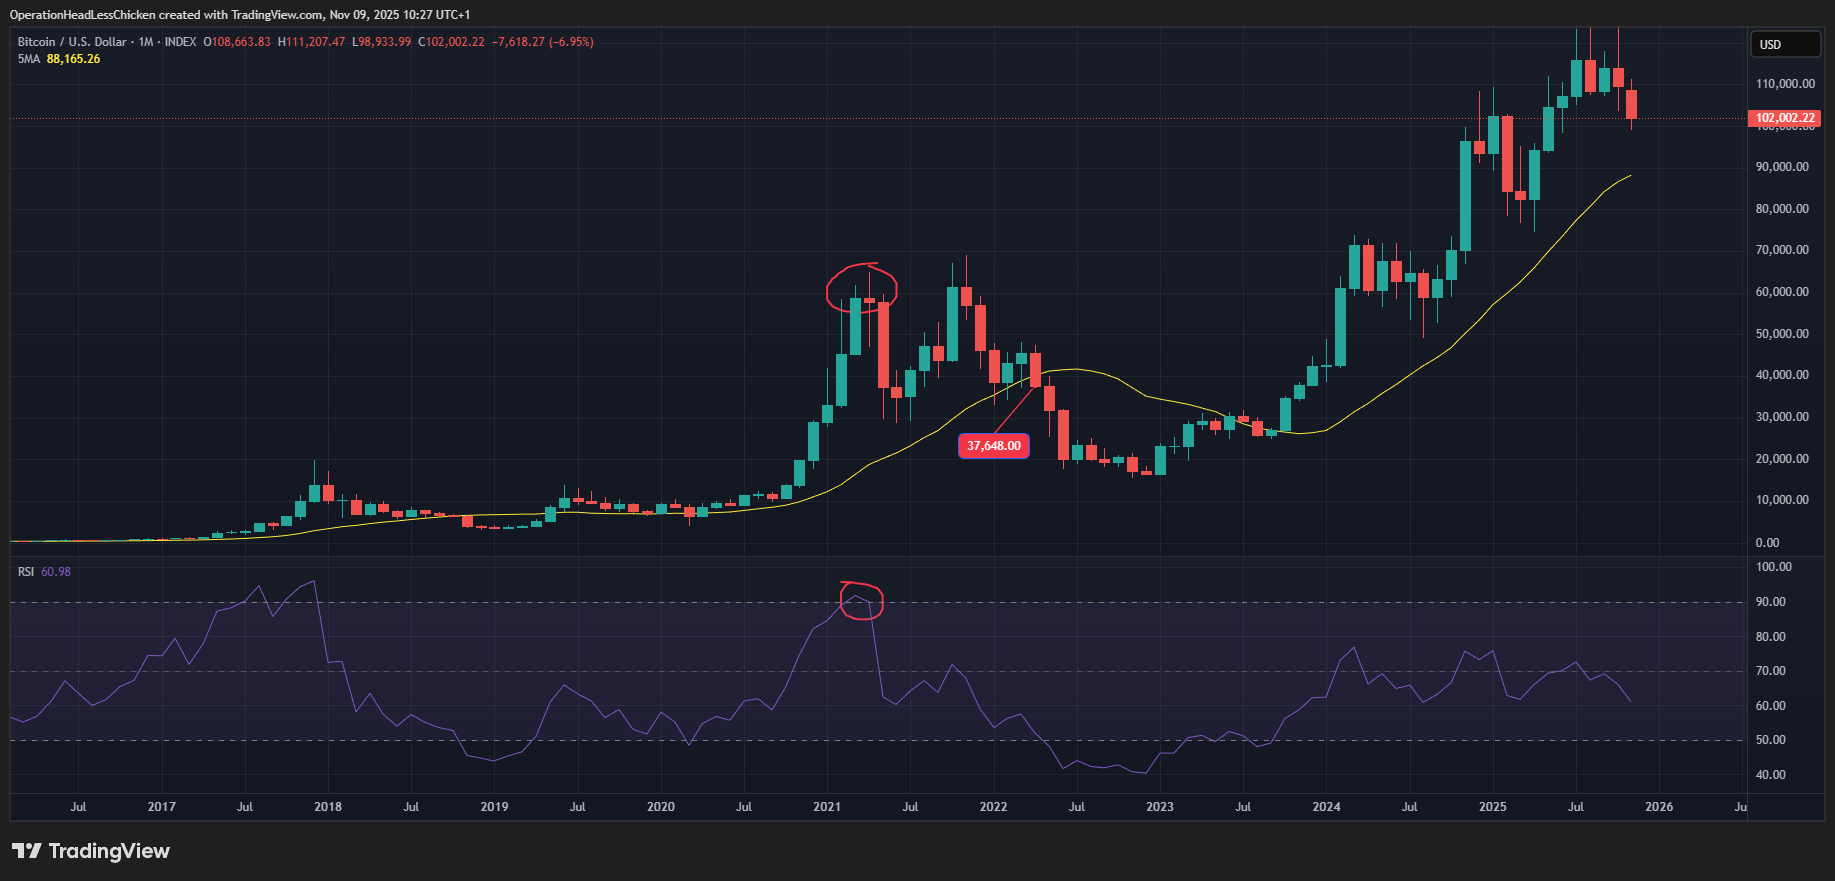
Figure 6: BTC exit based on 20-month MA
However, if you had exited based on the 20-week MA seen in Figure 7, you would have sold at 46,456 USD 6 weeks later. That’s a huge difference, both in price and time!
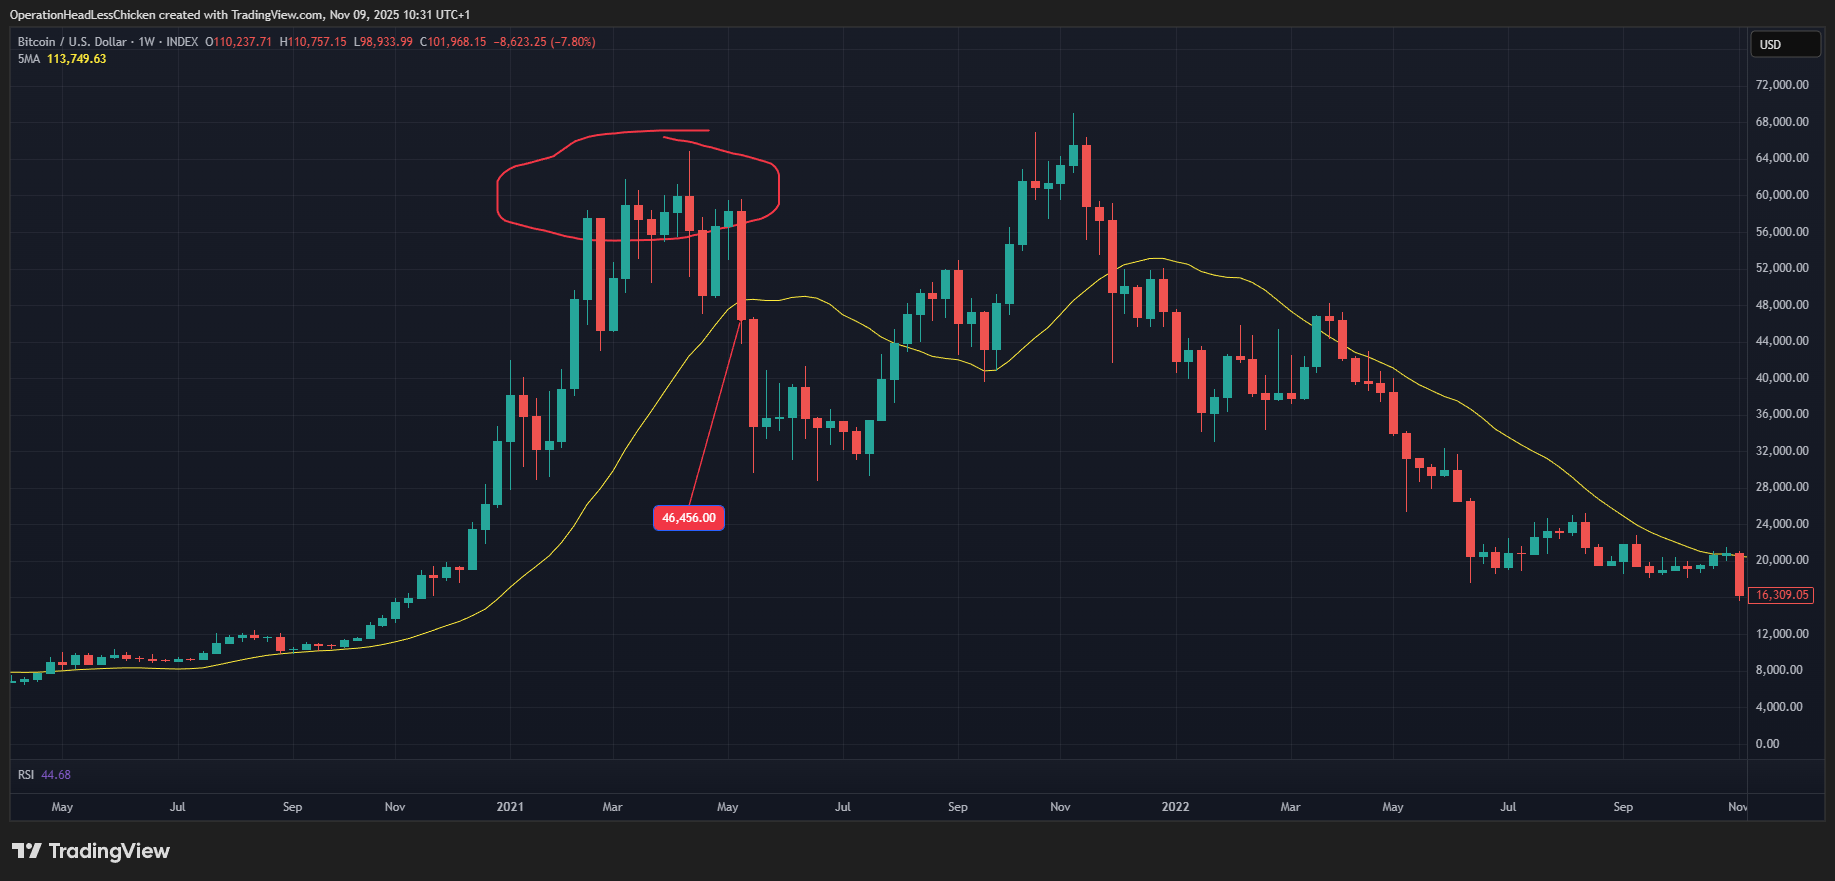
Figure 7: BTC exit based on 20-week MA
2.3 Short-term trading
So far we have discussed indicators that help you navigate the broader macro backdrop and the crypto market as a whole. These can be very helpful when making longer term investments. In this section, I will discuss how technical indicators can help you in short to mid-term trading.
2.3.1 200-day Moving Average (MA)
The 200-day MA is a simple, almost boring indicator, but don’t let it fool you, it works well.
- It is the average price of an asset over the last 200 days plotted as a line.
- Above it: bulls are dominating
- Below it: bears are in control
- Crypto markets are driven by momentum and the MA measures it
2.3.1.1 How to use it?
- Keep an eye on the project(s) that you are interested in. It is advisable that it has:
- A strong team shipping real products
- A large community
- A strong narrative that is easy to understand
- If a coin has been under its 200-MA for a while, and closes a full day above it, it can be a potential buying opportunity, but it needs confirmation:
- If the next couple of days stay above the MA and trend up, that’s a strong indicator of bullish momentum
- If the price is rejected for 2-3 consecutive days, the momentum is not there yet -> stay away
- A close above the 200-MA has to be examined in context. It needs a real fundamental catalyst, for example:
- A new token launch
- Tokenomics revamp
- Surge in user growth
- Stable coin growth: important indicator! More stable coins: more buying power. Can support the momentum
- When to ignore the close above 200-MA?
- When fundamentals don’t match up with the technicals, e.g.:
- Large multi-month supply unlock
- Prominent team member leaving the project
- Backdrop from BTC and ETH: consistent ETF outflows -> not good to buy
- When fundamentals don’t match up with the technicals, e.g.:
Put together:
- The 200-MA gives the signal that the downtrend might be over
- Catalysts and flows tell you if it is worth stepping in
-> This sounds simple, but it is not easy. You need patience. Most market participants lack it.
2.3.2 Sideways markets
In the 200-day MA section we discussed trending markets, but sideways markets are a different beast, therefore you need a different set of tools to trade them successfully.
Many traders avoid them entirely because there is a high chance that you get chopped up and lose money. It is a completely valid approach. However, if you still want to trade, keep in mind:
- This is a risky market environment, use small positions, while you sit on your main portfolio
- You will need tools suited for these conditions, so read on!
2.3.2.1 Relative Strength Index (RSI)
Again? Yes, we summon our old friend again. As we have seen earlier, the RSI shines in sideways markets.
On the daily timeframe, you can trade like this:
- Make sure that the market is moving sideways. You can do this by determining clear support and resistance levels, see Figure 8
- If price is near a support, and RSI cools towards the lower band (30-40 or lower) we look for a
bounceto get in - If price is near resistance, and RSI goes up (60-70 or higher), we look for a
rejectionto short
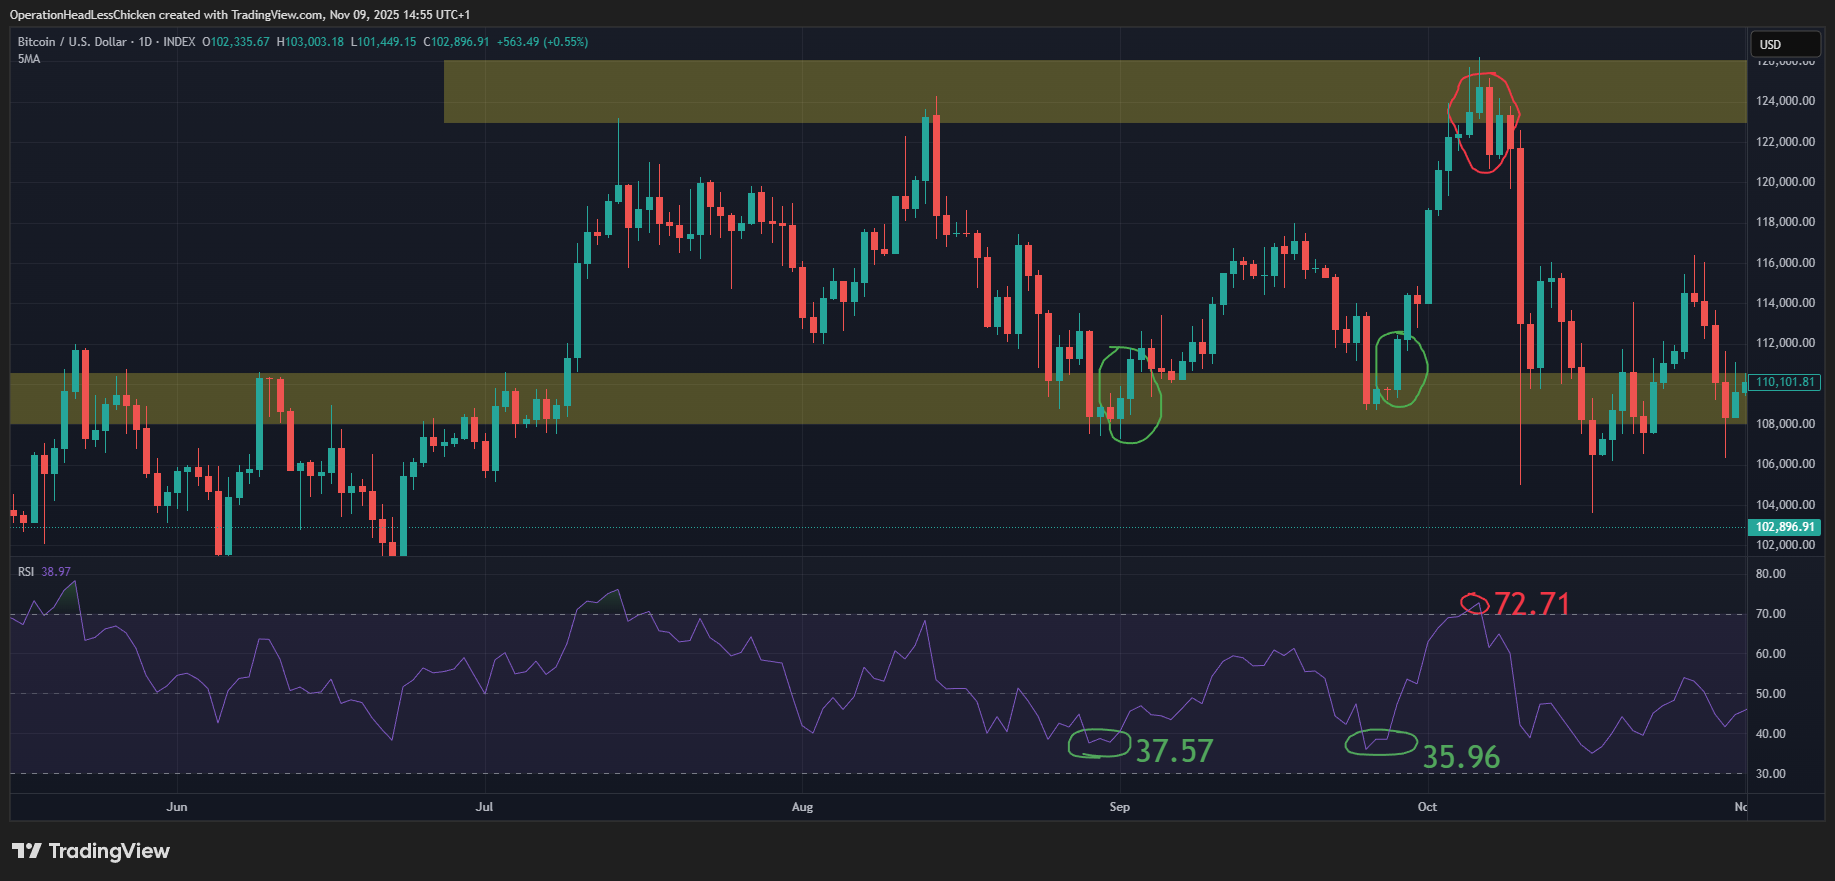
Figure 8: BTC sideways market and RSI trading, daily
In Figure 8 you can see some examples of this concept. Green marking long entries, red marking a short entry. You can also see the corresponding RSI value. The bounce or rejection are always a big bodied bullish/bearish candle in the chart.
Here, context is key: it must be a sideways market. RSI is not so useful in trending markets. It can stay overbought or oversold for a long time.
2.3.2.2 Bollinger Bands (BB)
Bollinger Bands (BB) are elastic guardrails around a simple MA. They expand when volatility rises, and tighten when it lowers. The most common settings:
- Middle band:
20 MA(as I mentioned earlier) - Upper and lower bands:
2 standard deviationsaway from the middle band
Most of the time, the price moves between the two outer bands. When it touches one of them, it often reverts towards the middle (mean reversion).
When the two outer bands are squeezing together, a breakout can be expected
You can read more about the BB on Investopedia.
Let’s have a look at our previous example, but now utilising Bollinger Bands:
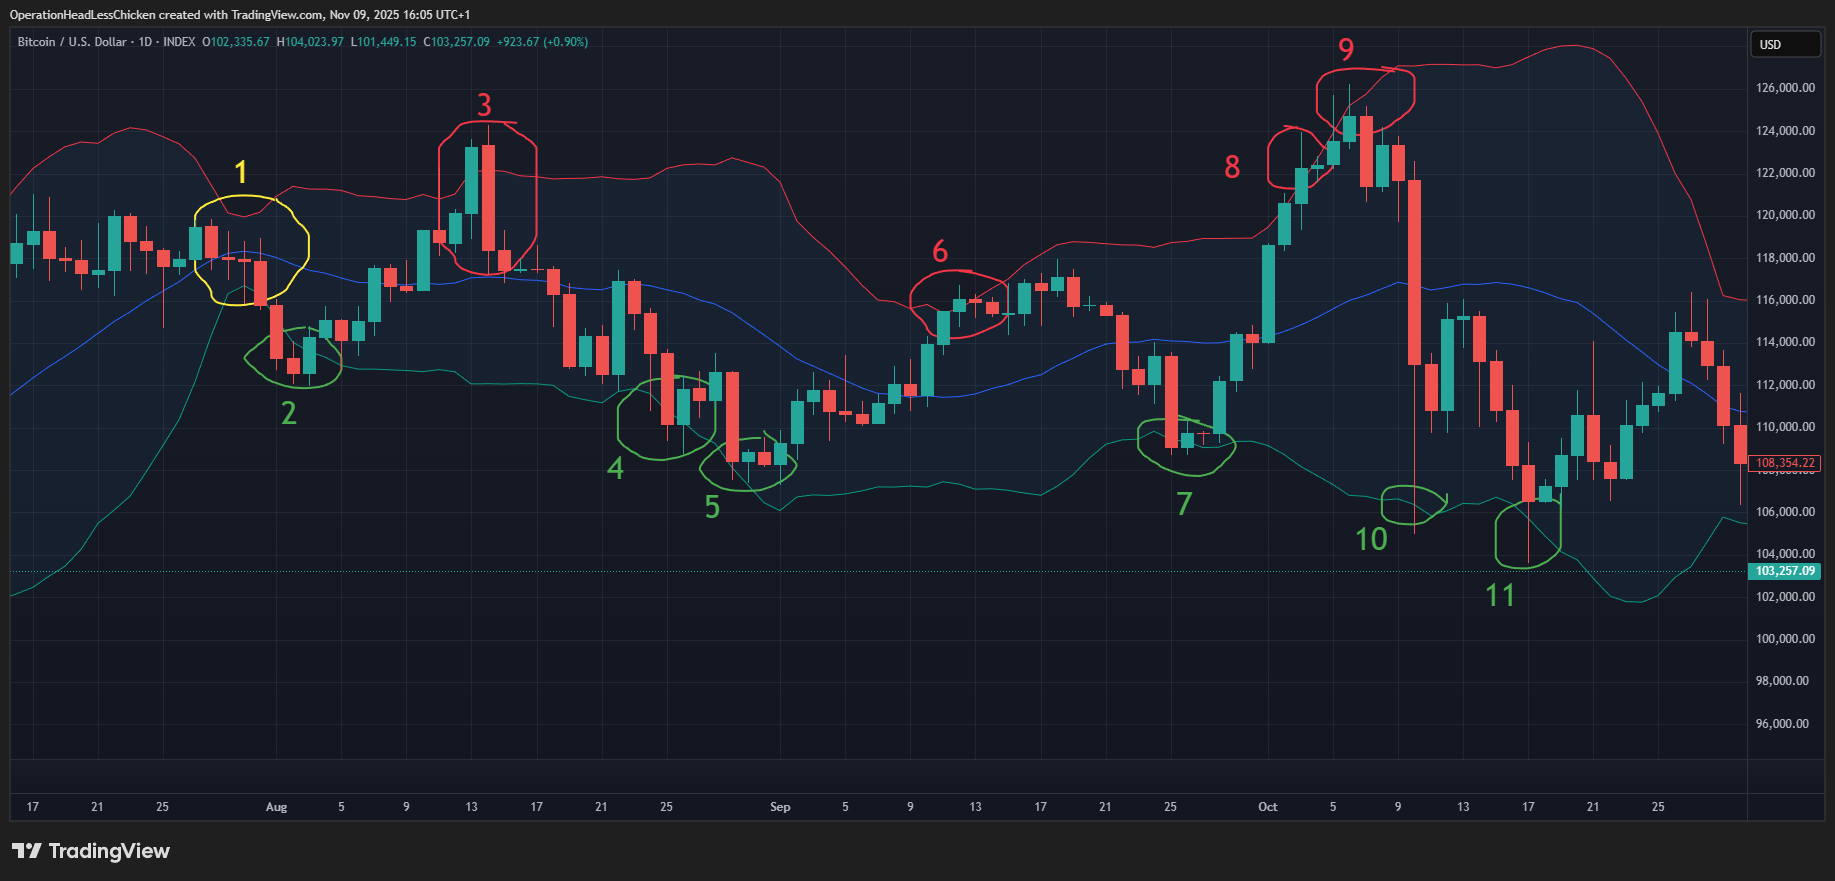
Figure 9: BTC sideways market and BB, daily
In Figure 9 you can see the following cases:
1: The BB is squeezing together, and as mentioned before, it is followed by a breakout. This time to the down-side (two large red candles)2,5,7,11: pretty good long entries, 10 as well, if you manage to catch the wick4: a potentially losing long (depending on your Stop Loss (SL))3,9: pretty good short signals6: a decent short signal, if the initial upward movement doesn’t stop you out8: a potentially losing short (depending on your SL)
As you can see, the BB seem to work pretty well, at least according to this admittedly small sample.
2.3.2.3 Combining the RSI and BB
Combining the two previous indicators is a really powerful approach in sideways markets:
- RSI heating up over 70: overbought territory + price touches the upper band -> good spot to sell
- RSI cooling down under 30: oversold + price touches the lower band -> time to buy
Let’s see our example again:
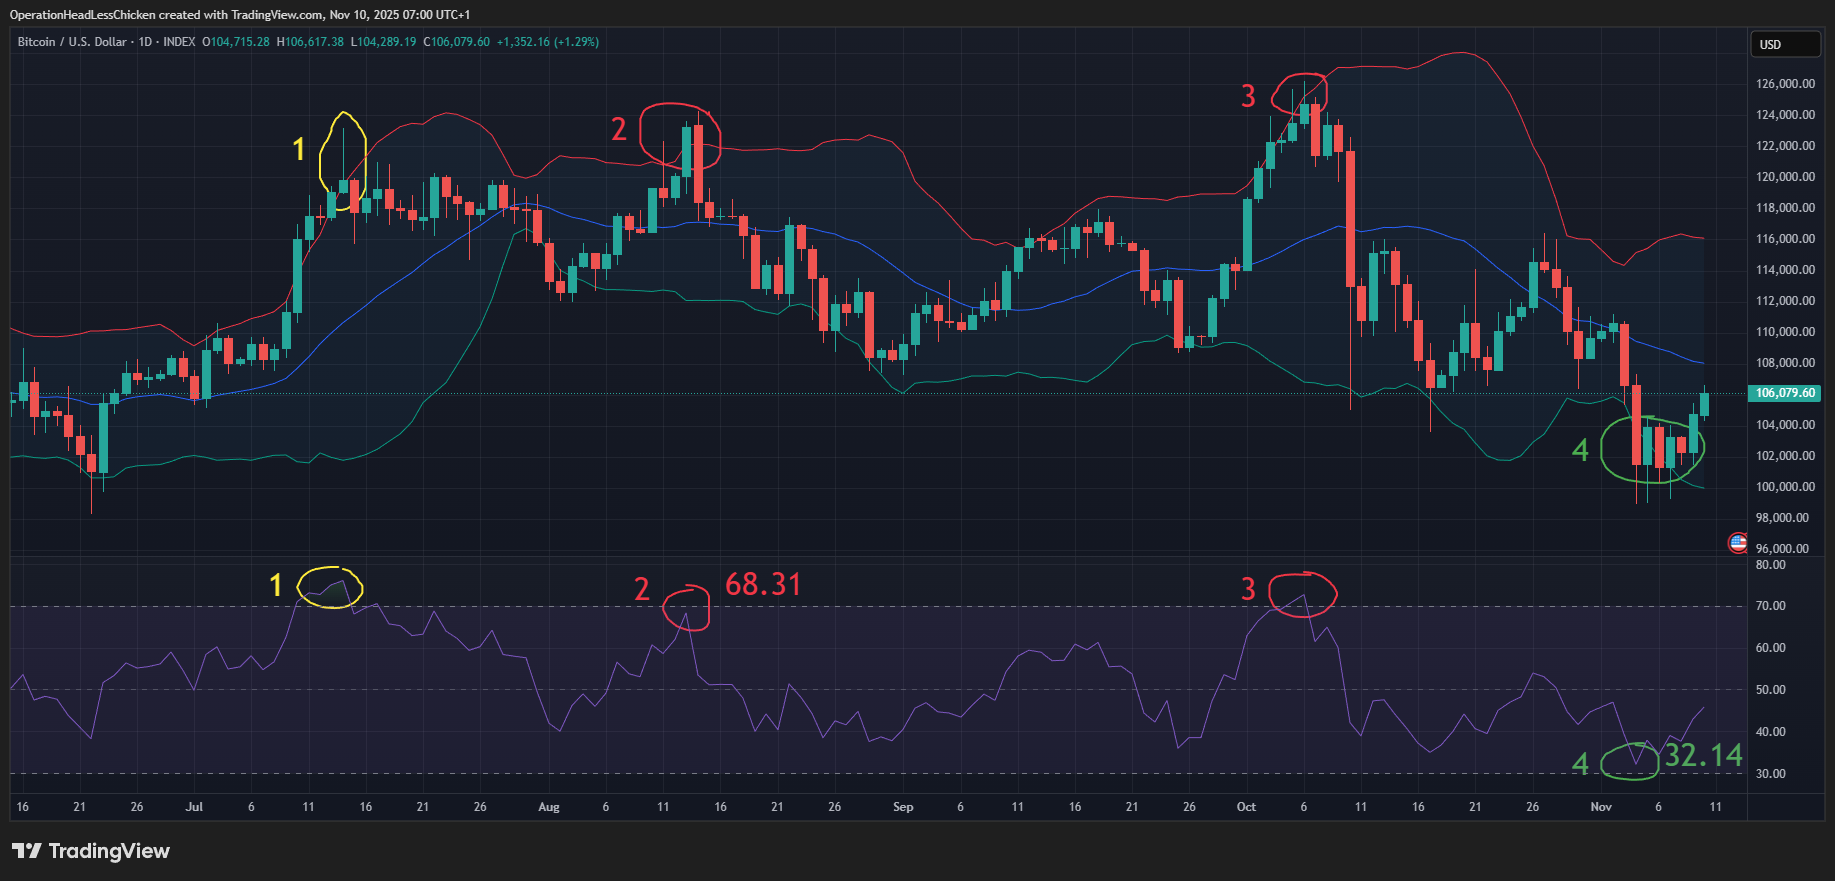
Figure 10: BTC sideways market, RSI and BB signals, daily
As you can see in Figure 10, we got fewer, but higher quality signals:
1, marked with yellow circle is not a valid signal, because the market is not moving sideways. It is in a strong uptrend. It ran to an All-Time High (ATH).2,4: touch theBB, and they come close on theRSI, but don’t quite reach it. Regardless,2worked out pretty well, and whether4will work out or not, I don’t know at the time of writing. It will be interesting to see. (Opening on these signals would mean relaxing the rules of the strategy which may or may not be acceptable. Only backtesting could tell.)3: the only clean signal, that fulfills all the criteria:sideways market+touches the BB+RSI at least 70.
3 Conclusion
In this post we have learned about some common technical indicators: Moving Averages (MA), Relative Strength Index (RSI) and Bollinger Bands. We have seen how they work on long, mid and short-term timeframes as well. Their versatility and effectiveness are thanks to the fact that they all measure the market sentiment in some way, and due to their simplicity many traders watch them, strengthening their self-fulfilling property.
This concludes my research on crypto market indicators, but there is still one post remaining. In the next post I will publish a cheatsheet that summarises briefly each indicator discussed in this series. It will give you a quick overview and the most important signals they can provide, and my final thoughts about this topic. Thanks for reading, stay tuned!
4 Glossary
- Alts: Altcoins, alternative coins, all cryptos, except for BTC
- ATH: All-Time High
- BB: Bollinger Bands
- BTC: Bitcoin
- DCA: Dollar Cost Average
- ETF: Exchange-Traded Fund
- ETH: Ethereum
- MA: Moving Average, often Simple Moving Average (SMA)
- RSI: Relative Strength Index
- SL: Stop Loss
5 Links and further reading
- Part 1: Puell Multiple and Its Improvements
- Part 2: Bitcoin Price Prediction
- Part 3: US Dollar Index and Bitcoin Dominance
- Part 4: Pi Cycle Top and MVRV Z-score
- Part 6: Indicator Cheat Sheet
- Relative Strength Index (RSI)
- Bollinger Bands (BB)
- Stop Loss (SL)
Comments