Crypto Market Indicators - Part 4: Pi Cycle Top and MVRV Z-score
Disclaimer: Nothing in this post should be taken as financial advice. Trading involves risk, and you are solely responsible for your own decisions and potential losses.
1 Introduction
This is part 4 in my Crypto Market Indicators series, loosely related to
Closely related to
- Part 3: US Dollar Index and Bitcoin Dominance
- Part 5: The Versatile Technical Indicators!
- Part 6: Indicator Cheat Sheet
as they are all outcomes of the same research effort.
2 Indicators
This section picks up where Part 3 Indicators section left off and goes one level deeper in the rabbit hole: Part 3 discussed macro and global crypto indicators, while this part zooms in on Bitcoin itself. The indicators introduced here will still carry valuable information about the crypto sector as a whole, since Bitcoin is so dominant in the market.
2.1 Pi Cycle Top
The Pi cycle top is a combination of two daily moving averages (MA):
111 day MA(fast): Represents short-term market momentum. How fast Bitcoin’s price is rising in recent months.2 * (350 day MA)(slow): Represents a longer-term trend line, multiplied by two
It is called Pi because 350 / 111 = 3.153, which is close to the mathematical constant, Pi (3.1415).
- The fast line (orange in Figure 1) crossing above (marked by dashed lines) the slow line (green) has historically signaled cycle tops with surprising accuracy.
- We can also say that after a top signal, when the fast line returned below the slow one, BTC had already begun trending down (bear market).
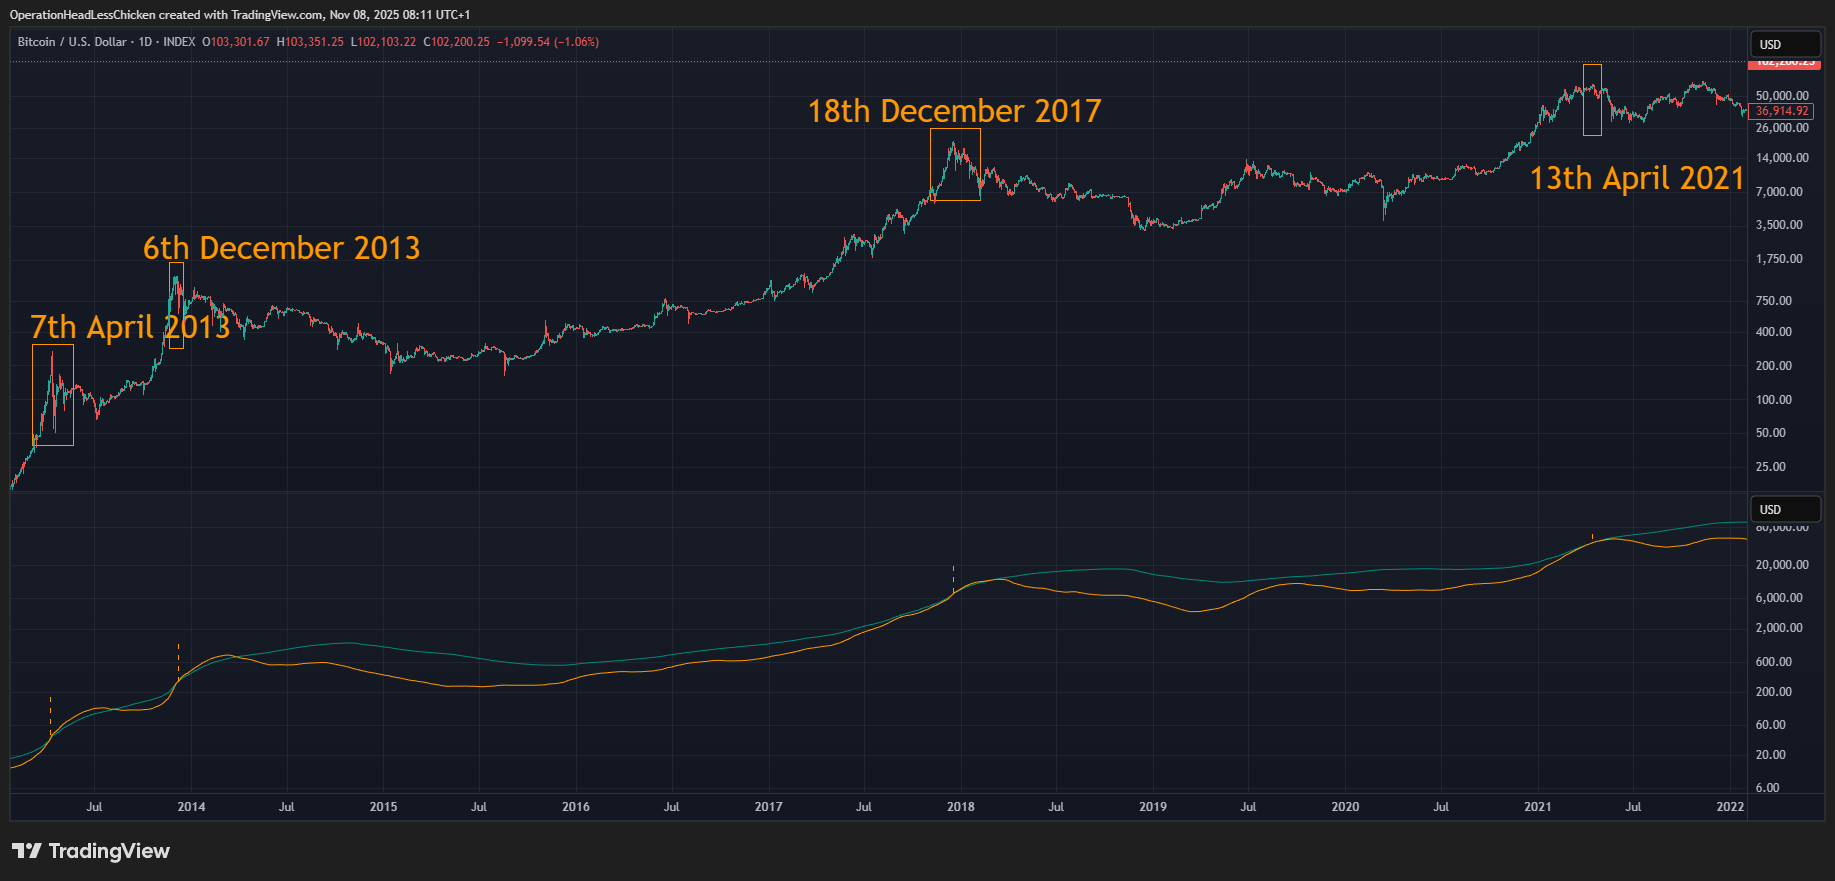
Figure 1: Pi top signals in the past
As you can see, it also produced a signal on 7th April 2013, which was a local top, not a cycle top. This means two things:
- What the indicator really does is signal overvalued, bubbly market conditions, it doesn’t care about market cycles or cycle tops really.
- Combine it with other signals to determine the real top:
- Vertical candles
- Euphoric sentiment
-> These combined can indicate quite well that it is time to sell. The Pi Cycle Top indicator can signal a bit early, but starting to scale out won’t hurt.
2.1.1 Caveats
- Can signal a bit too early
- It can happen that it won’t signal at all if there isn’t an explosive spike in price. This is a real possibility in 2025 and later, since the market has changed with all the institutions and treasury companies entering. Bitcoin has been in a long gradual uptrend since November 2022, and as you can see in Figure 2, the fast MA doesn’t seem to be able to catch up with the green line (green box area).
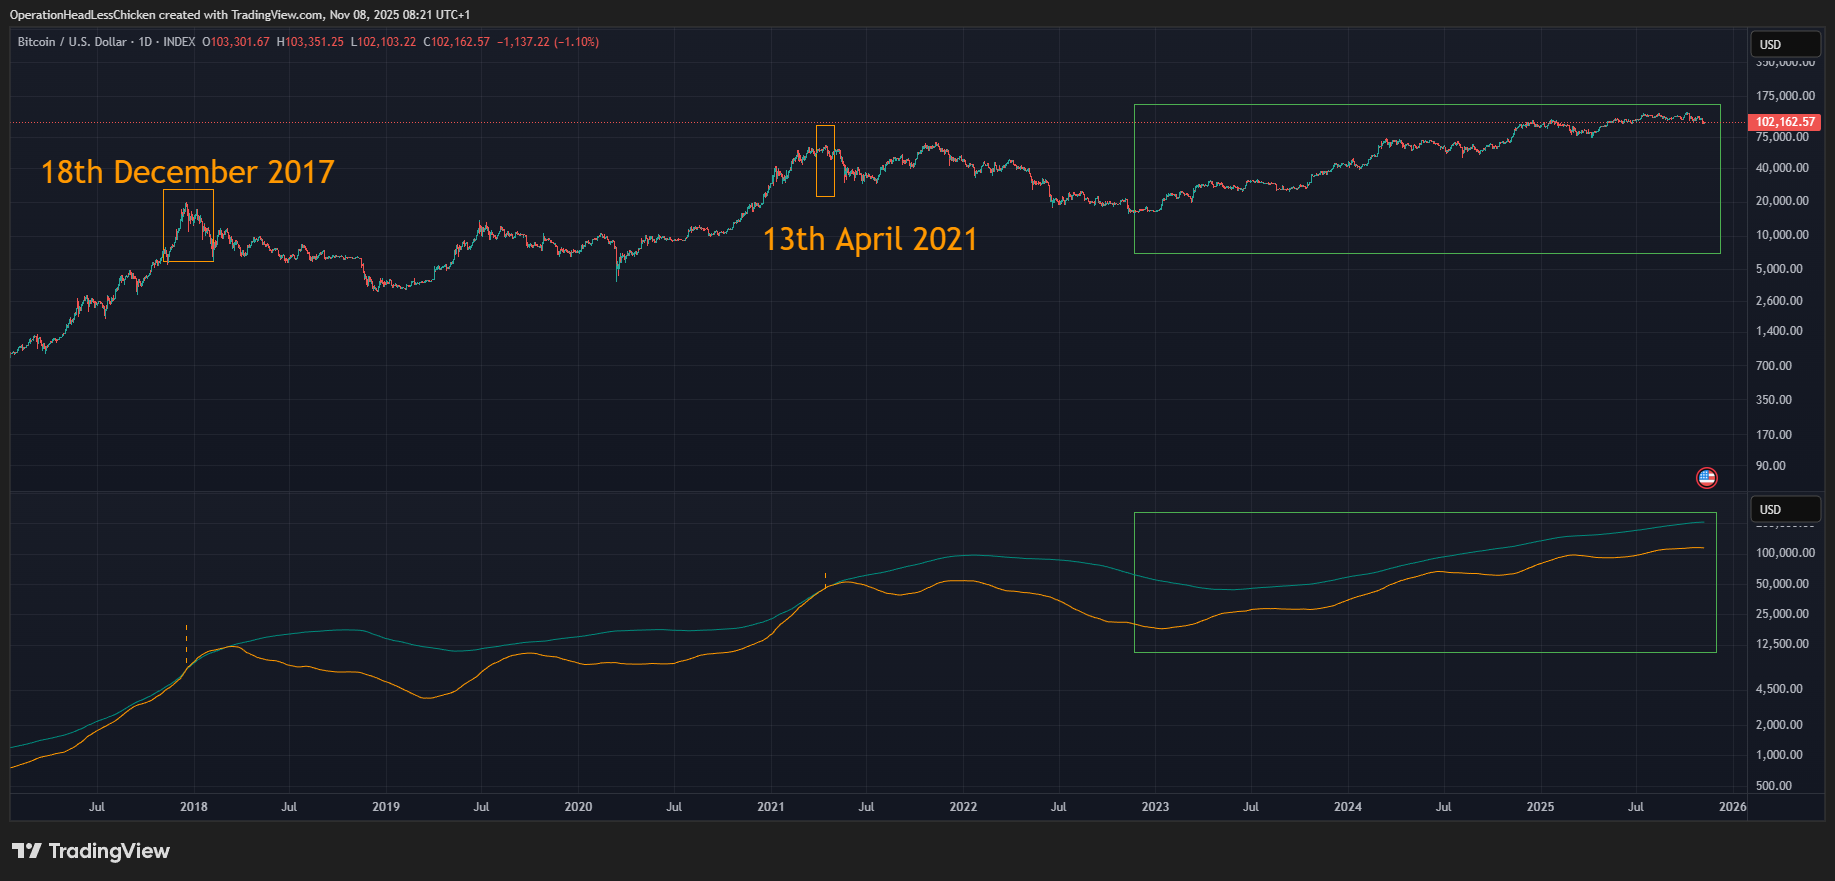
Figure 2: Long, gradual uptrend
2.2 MVRV Z-Score
It shows how much profit/loss BTC holders are currently sitting on.
- If they are sitting on a lot of profit, the market is likely overvalued. If they are sitting on a lot of loss, it is likely undervalued.
- Historically, it has been very good at pointing out market tops and bottoms.
Fun fact: David Puell, author of the Puell Multiple is also the co-author of MVRV Z-score.
2.2.1 What does this complicated name mean?
It is not as complicated as it sounds. Let’s break it down, so you can remember it more easily. MVRV Z-score consists of two components (MV and RV), and a metric (Z-score) derived from them:
- MV: Market Value (current market capitalisation (market cap) of BTC)
- RV: Realised Value: (the value at which BTC holders bought their BTC originally)
- Z-score: a standardised value calculated from MV and RV
You can read more about it on Coinglass.
I will use MVRV Z-score and Z-score interchangeably from now on to type less.
2.2.1.1 How to use it?
It works best on higher timeframes, such as the weekly or monthly, as it gives cleaner signals.
Historically:
- A high Z-score (above 6, Figure 3) indicated lots of unrealised profit, indicating overvalued market, usually lining up with tops (red circles)
- A low Z-score (below 0) meant holders are in deficit, lining up with bear market bottoms (green circles)
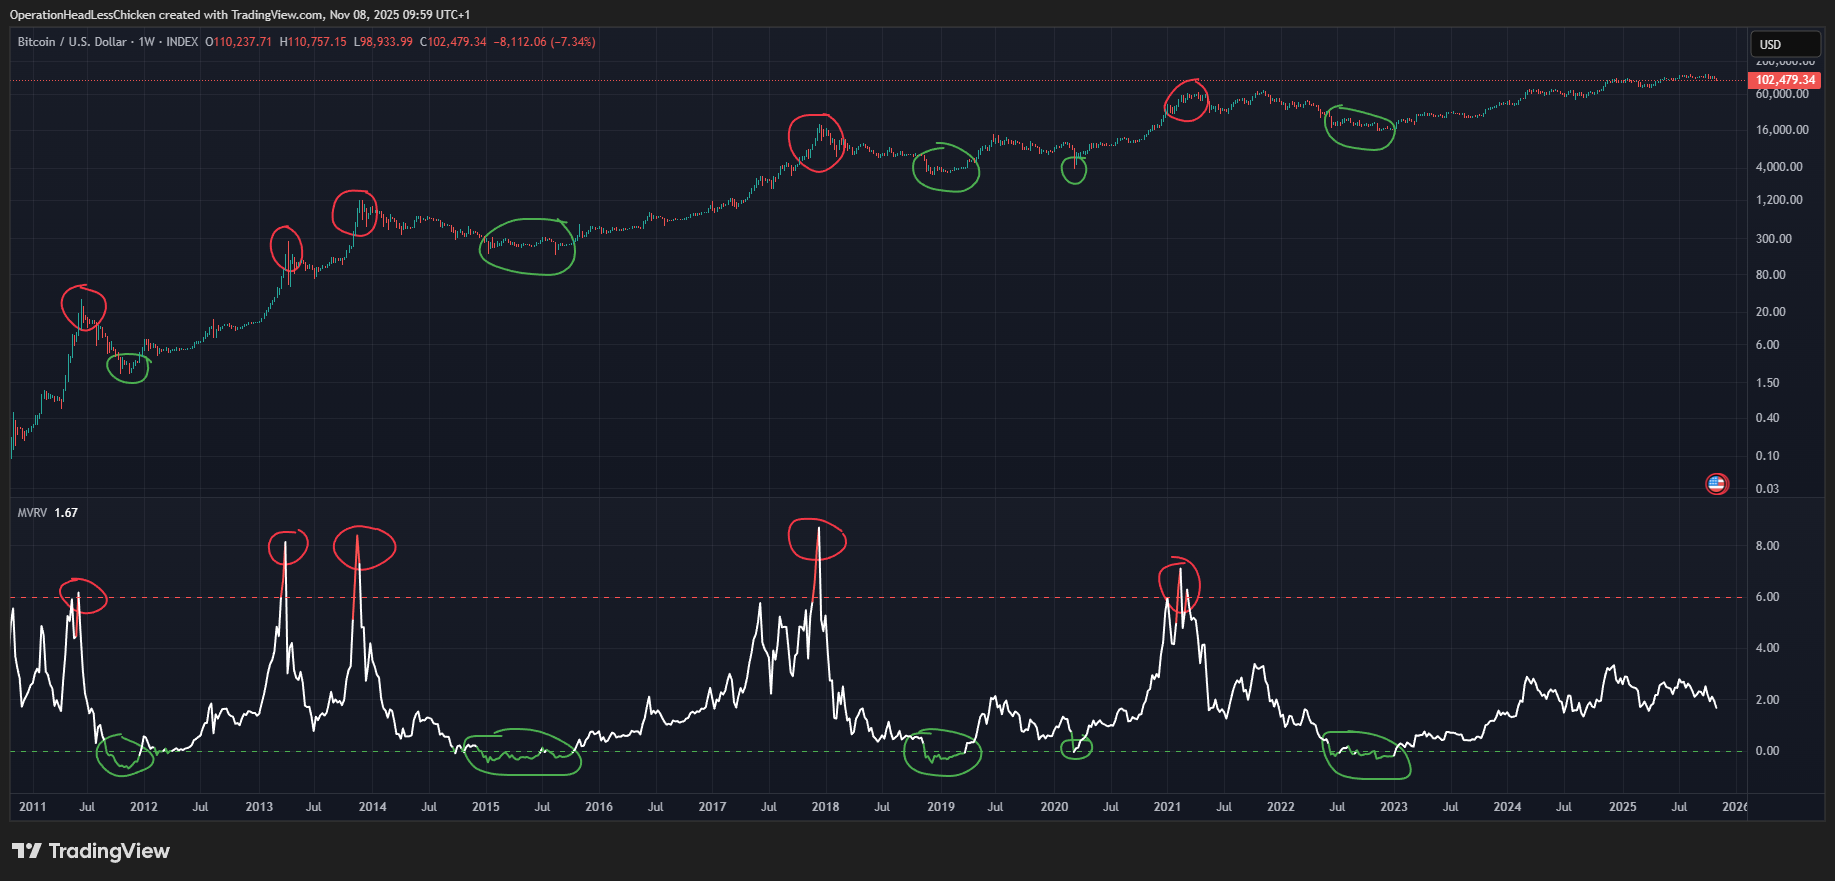
Figure 3: MRVR Z-score on the weekly
That was in the past, at least. Now the story looks a bit different:
- Despite BTC having gone up significantly in the past year, the Z-score still stays in the middle range, not touching overvalued territory. This means that coins are sold and repriced continuously, instead of the big retail meltup we saw in the previous cycles.
- Big buyers, like ETFs and treasury companies (Digital Asset Treasury, DAT) keep buying the dips and higher prices as well, smoothing out the Z-score, so we cannot expect such extreme value spikes as those around the 2017 or 2021 tops
However, this doesn’t mean that the Z-Score has become obsolete, we just need to interpret it differently:
- If Z-score starts ripping higher quickly, while ETFs and DATs are stalling or selling, that smells like froth. It means the price is going up without the bid from the big players
- If Z-score cools off, while the big players are buying, it means a healthy market conditions. The market cools, and is digesting gains
- The Z-score would still be a clear bottom signal in the bear market. This is because the bear market would put pressure on smaller holders, trigger liquidations, and this will cascade to bigger players as well. Demand will be close to zero.
2.2.1.2 Caveats
- Can signal too early
- Can move sideways in the mid-range if the market has intense flows
3 Conclusion
In this post I have discussed two Bitcoin specific indicators, Pi Cycle Top and MVRV Z-score. They have a good track record of signaling Bitcoin cycle tops. It is important because BTC leads the crypto market, and around the time it tops, alts have their big rally too. However, the market is maturing, which means that we will need a bit different approach when utilising them. We cannot expect the market to become so overheated anymore, and we have to interpret these signals more in context.
In Part 5, we will go one more level lower in the indicator hierarchy, and have a look at technical indicators. They are versatile and powerful tools that can be combined with each other and other indicators as well. Personally, I am a big fan of them. :) See you there!
4 Glossary
- BTC: Bitcoin
- DAT: Digital Asset Treasury
- ETF: Exchange-Traded Fund
- MA: Moving Average, often Simple Moving Average (SMA)
- MVRV Z-score:
- MV: Market Value (current market cap of BTC)
- RV: Realised Value: (the value at which BTC holders bought their BTC originally)
- Z-score: a standardised value calculated from MV and RV
5 Links and further reading
- Part 1: Puell Multiple and Its Improvements
- Part 2: Bitcoin Price Prediction
- Part 3: US Dollar Index and Bitcoin Dominance
- Part 5: The Versatile Technical Indicators!
- Part 6: Indicator Cheat Sheet
Comments