Crypto Market Indicators - Part 2: Bitcoin Price Prediction
Disclaimer: Nothing in this post should be taken as financial advice. Trading involves risk, and you are solely responsible for your own decisions and potential losses.
Introduction
Predicting Bitcoin’s price for the cycle top is a fool’s game, and any prudent person with some self-respect should stay away from it.
In my view, it is like playing the lottery. I have a very high chance of not winning anything, and only a negligible chance of hitting the jackpot. If I don’t guess the top, I will be just one of the thousand fools being born every freakin’ day. But if I nail it, that is a pretty nice achievement that I can brag about, so I will give it a shot.
At the end of the post, you will find my price predictions, but be prepared for some math along the way. (Any Bad Religion fans here?). Feel free to jump ahead to the final numbers, but I won’t give you a jump link here, so at least you have to work a little bit for it. ;)
My prediction model
Since I wrote a deep dive about the Puell Multiple in my previous post, I use it as a basis for my calculations.
Step 1: Predicting the Puell Multiple
In my previous post, I introduced a corrected version of the Puell Multiple, which allows one to assign an overvalued threshold of 12.49 to the indicator. If you are not familiar with how it works feel free to check out its details here.
Looking at the historical behaviour of the Halving-Corrected Puell Multiple, I came up with these three cases:
- Conservative case:
10.4: this was the value at peak (5), when there was a cycle top, but the indicator didn’t reach the overvalued territory - Base case:
12.5: just a bit above the overvalued line - Bull case:
13.61: the value at peak (3) from December 2013, when the indicator shot over the threshold by a good margin. It hasn’t been there since, and it is unlikely to revisit that value.
The current correction factor, after the 4th halving is $1,63^4 = 7.059$. Dividing the above three cases by 7.059, I transformed them back to the original Puell Multiple’s scale:
- Conservative case:
1.4733 - Base case:
1.7708 - Bull case:
1.9252
Step 2: Calculating the Miner Revenue from the Puell Multiple
The Puell Multiple is a ratio between the Current Miner Revenue and the 365-Day Moving Average of the Miner Revenue. We know the ratio. In order to calculate either term of the ratio, we have to know the other one. Here, it is easier to predict the Moving Average, as its movement is much smoother and more predictable than the erratic raw Miner Revenue.
The 365-day Moving Average of the Mining Revenue is at 44.752M USD on the monthly chart at the time of writing. We can expect that it will go higher as the Miner Revenue goes higher while we are approaching the cycle top, so even the conservative case should be higher than the current value. My Miner Revenue MA estimates based on this, are:
- Conservative case:
46.8M - Base case:
50M - Bull case:
52M
Multiplying the Miner Revenue MA values by the previously estimated Puell Multiples gives us nine (three times three) possible Miner Revenue values at the cycle tops. I leave the arithmetic to the reader.
Step 3: Calculating Bitcoin’s price from Miner Revenue
Miners get their rewards in Bitcoin for their effort to secure the network. Since we have Miner Revenue estimations from the previous step in USD, we need to know (estimate) how many Bitcoin is issued daily, then it becomes a simple divison:
Luckily, this data is available on MacroMicro for free.
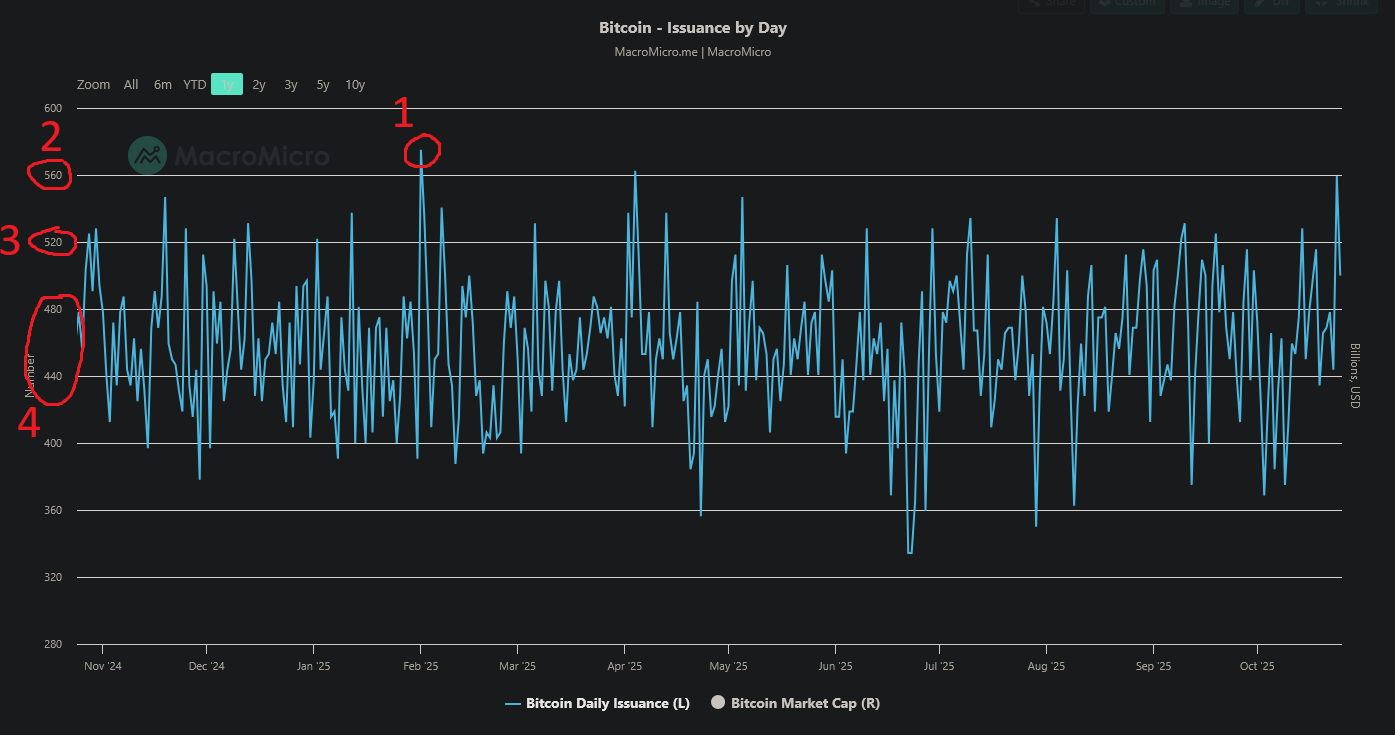
Figure 1: Bitcoin Issuance by Day (source: MacroMicro)
In Figure 1, you can see the daily Bitcoin issuance for the past year. As discussed in my previous post, the Miner Revenue (and thus the Bitcoin issuance) consists of two parts:
- The block reward: it is fixed and doesn’t change between halvings
- Transaction fees: depends on the network traffic
As you can see, Bitcoin issuance changes from day to day, and in the past one year we can see that
- The highest value it hit was 575 Bitcoin (BTC) ((1) in Figure 1)
560BTC was a well respected level, touched only 3 times (2)- We can consider
520BTC relatively high, with most of the days being below it (3) - The average falls between
480and440a day, so we can say that480is above average (4)
When Bitcoin’s price hits All-Time Highs (ATH), we can expect more attention from traders and investors, which translates to more transactions on the network, therefore I expect above average transaction fees issued. My estimates are:
- Conservative case:
480 - Base case:
520 - Bull case:
560
By dividing our Miner Revenue estimates by these daily issuance values, we will get three estimates for each.
Step 4: Putting it all together
As we have seen, in Steps 1, 2 and 3, we have three parameters of the equation that I had to estimate:
- The Puell Multiple
- Moving Average of the Miner Revenue
- Daily Issuance
The equation itself is as follows
\[\text{Bitcoin price} = \frac{ \text{Miner Revenue MA} * \text{Puell Multiple} }{ \text{Bitcoin's daily issuance} }\]I have estimated three cases (conservative, base and bull) for each of these parameters. Calculating all combinations yields 3x3x3 = 27 Bitcoin price estimations. (you can find the results in the Appendix).
Now you could say that I am cheating, because that is 27 lottery tickets as opposed to one. Okay, let’s narrow it down:
- The
minimumestimated price is123125.5USD, which Bitcoin has already surpassed at the time of writing. - The
maximumestimated price is208563.5USD - The
averageof all estimations is165009USD
Now I have narrowed it down to three “tickets” (one of which is already out of the game). Are you still not happy? Okay, I will give you my base case, which is the value you get when you take the base cases of each parameter in the calculation:
- Puell Multiple =
1.7708 - Miner Revenue MA =
50M USD - Bitcoin Daily Issuance =
520.
This gives us 170268.2 USD.
Conclusion
In this post, I have described my simple mathematical model based on the Puell Multiple to predict Bitcoin’s cycle top price. It has three input parameters, that I had to estimate. I estimated a conservative, a base and a bull case for each of these parameters. Calculating all combinations gave me 27 values that I could analyse statistically (min, max, average). I have also provided my base case that is calculated from the base cases of all the parameters.
My intuition
- Personally, I like the
averagevalue of the result set, which is165009 USD. I feel it realistic than thebase case: - The base case of
170268.2 USD, even though it is calculated from my base case parameters, feels a bit high, but who knows, Bitcoin could surprise us to the upside (writing it on 27th October 2025).
So if I had to pick one simple, marketable number, I would go with 165000 USD for Bitcoin.
Thanks for reading. Let me know in the comments what you think about this estimation, and how it compares to yours!
Glossary
- ATH: All-Time High
- BTC: Bitcoin
Links
- Part 1: Puell Multiple and Its Improvements
- Part 3: US Dollar Index and Bitcoin Dominance
- Part 4: Pi Cycle Top and MVRV Z-score
- Part 5: The Versatile Technical Indicators!
- Part 6: Indicator Cheat Sheet
- Bitcoin issuance
Appendix
| Revenue MA (M USD) | Puell Multiple | Revenue (M USD) | BTC Issuance | Price Pred (USD) |
|---|---|---|---|---|
| 46.8000 | 1.4733 | 68.9503 | 480 | 143646.4 |
| 46.8000 | 1.4733 | 68.9503 | 520 | 132596.7 |
| 46.8000 | 1.4733 | 68.9503 | 560 | 123125.5 |
| 46.8000 | 1.7708 | 82.8729 | 480 | 172651.9 |
| 46.8000 | 1.7708 | 82.8729 | 520 | 159371.0 |
| 46.8000 | 1.7708 | 82.8729 | 560 | 147987.4 |
| 46.8000 | 1.9252 | 90.0994 | 480 | 187707.2 |
| 46.8000 | 1.9252 | 90.0994 | 520 | 173268.2 |
| 46.8000 | 1.9252 | 90.0994 | 560 | 160891.9 |
Table 1: Revenue MA = 46.8 M USD
| Revenue MA (M USD) | Puell Multiple | Revenue (M USD) | BTC Issuance | Price Pred (USD) |
|---|---|---|---|---|
| 50.0000 | 1.4733 | 73.6648 | 480 | 153468.4 |
| 50.0000 | 1.4733 | 73.6648 | 520 | 141663.1 |
| 50.0000 | 1.4733 | 73.6648 | 560 | 131544.3 |
| 50.0000 | 1.7708 | 88.5395 | 480 | 184457.2 |
| 50.0000 | 1.7708 | 88.5395 | 520 | 170268.2 |
| 50.0000 | 1.7708 | 88.5395 | 560 | 158106.2 |
| 50.0000 | 1.9252 | 96.2601 | 480 | 200541.9 |
| 50.0000 | 1.9252 | 96.2601 | 520 | 185115.6 |
| 50.0000 | 1.9252 | 96.2601 | 560 | 171893.0 |
Table 2: Revenue MA = 50 M USD
| Revenue MA (M USD) | Puell Multiple | Revenue (M USD) | BTC Issuance | Price Pred (USD) |
|---|---|---|---|---|
| 52.0000 | 1.4733 | 76.6114 | 480 | 159607.1 |
| 52.0000 | 1.4733 | 76.6114 | 520 | 147329.7 |
| 52.0000 | 1.4733 | 76.6114 | 560 | 136806.1 |
| 52.0000 | 1.7708 | 92.0810 | 480 | 191835.5 |
| 52.0000 | 1.7708 | 92.0810 | 520 | 177078.9 |
| 52.0000 | 1.7708 | 92.0810 | 560 | 164430.4 |
| 52.0000 | 1.9252 | 100.1105 | 480 | 208563.5 |
| 52.0000 | 1.9252 | 100.1105 | 520 | 192520.2 |
| 52.0000 | 1.9252 | 100.1105 | 560 | 178768.7 |
Table 3: Revenue MA = 52 M USD
Comments