Crypto Market Indicators - Part 3: US Dollar Index and Bitcoin Dominance
Disclaimer: Nothing in this post should be taken as financial advice. Trading involves risk, and you are solely responsible for your own decisions and potential losses.
1 Introduction
Many believe that the crypto market cycle top is about to happen in late 2025 or early 2026. Perhaps there are even more who are wondering:
- Is it going to be different this time?
- Is the top already in, or is it still ahead of us?
- Will there be an altseason at all?
While these questions can only be answered with certainty in hindsight, there are indicators that can help you navigate this upcoming period. In the upcoming posts, I am going to discuss some of the most notable ones.
This is part 3 in my Crypto Market Indicators series. It is loosely related to Part 1: Puell Multiple and Part 2: Bitcoin Price Prediction, but is closely related to the upcoming parts 4-6, which are all products of the same research project.
2 Indicators
Two things are clear:
- Crypto is an asset class that is part of the global market, and thus affected by macro factors
- The crypto market is always led by Bitcoin (BTC), the rest of the cryptos (altcoins, alts) follow it
From this, we can say (a bit simplified) that the chain of effect is as follows: Global Market -> BTC -> altcoins.
In this series of posts, I will follow this top-down logic to discuss the indicators worth watching.
2.1 Macro Indicators
As discussed earlier, I will follow a top-down logic while going over the indicators. The first category in the hierarchy is the macro indicators that give us valuable insight into the world’s global economy. Even if you are only interested in your small-cap altcoin, this is a level you want to keep an eye on to get an idea of the general market condition.
2.1.1 US Dollar Index (DXY, “Dixie”)
The USD (though declining lately) has been the most dominant currency in world economics. The greatest part (54%) of global trade is still settled in USD, and therefore its strength or weakness has a great impact on the global economy. The Dollar’s strength is expressed by the US Dollar Index (DXY) which compares it to a basket of other major currencies:
- Euro (EUR), 57.6% weight
- Japanese yen (JPY), 13.6% weight
- Pound sterling (GBP), 11.9% weight
- Canadian dollar (CAD), 9.1% weight
- Swedish krona (SEK), 4.2% weight
- Swiss franc (CHF), 3.6% weight
As you can see, the Euro (EUR) and the Japanese Yen (JPY) have the greatest influence in the equation, therefore changes in their strength can have an impact on the DXY.
The DXY tells you how much liquidity there is in the global economy.
- Strong DXY means less liquidity
- Weak DXY means more liquidity
If the DXY goes up (USD is getting stronger), it drains liquidity from the markets and everything tends to go down, and vice versa.
2.1.1.1 DXY and the crypto market
Historically, when the DXY was in a medium term downtrend, the crypto market reacted as follows (source):
- First leg down: crypto rally led by BTC (marked as
Bin Figure 1) - DXY chops for a while: crypto consolidates (
C) - Second leg down: altcoin season (
A)
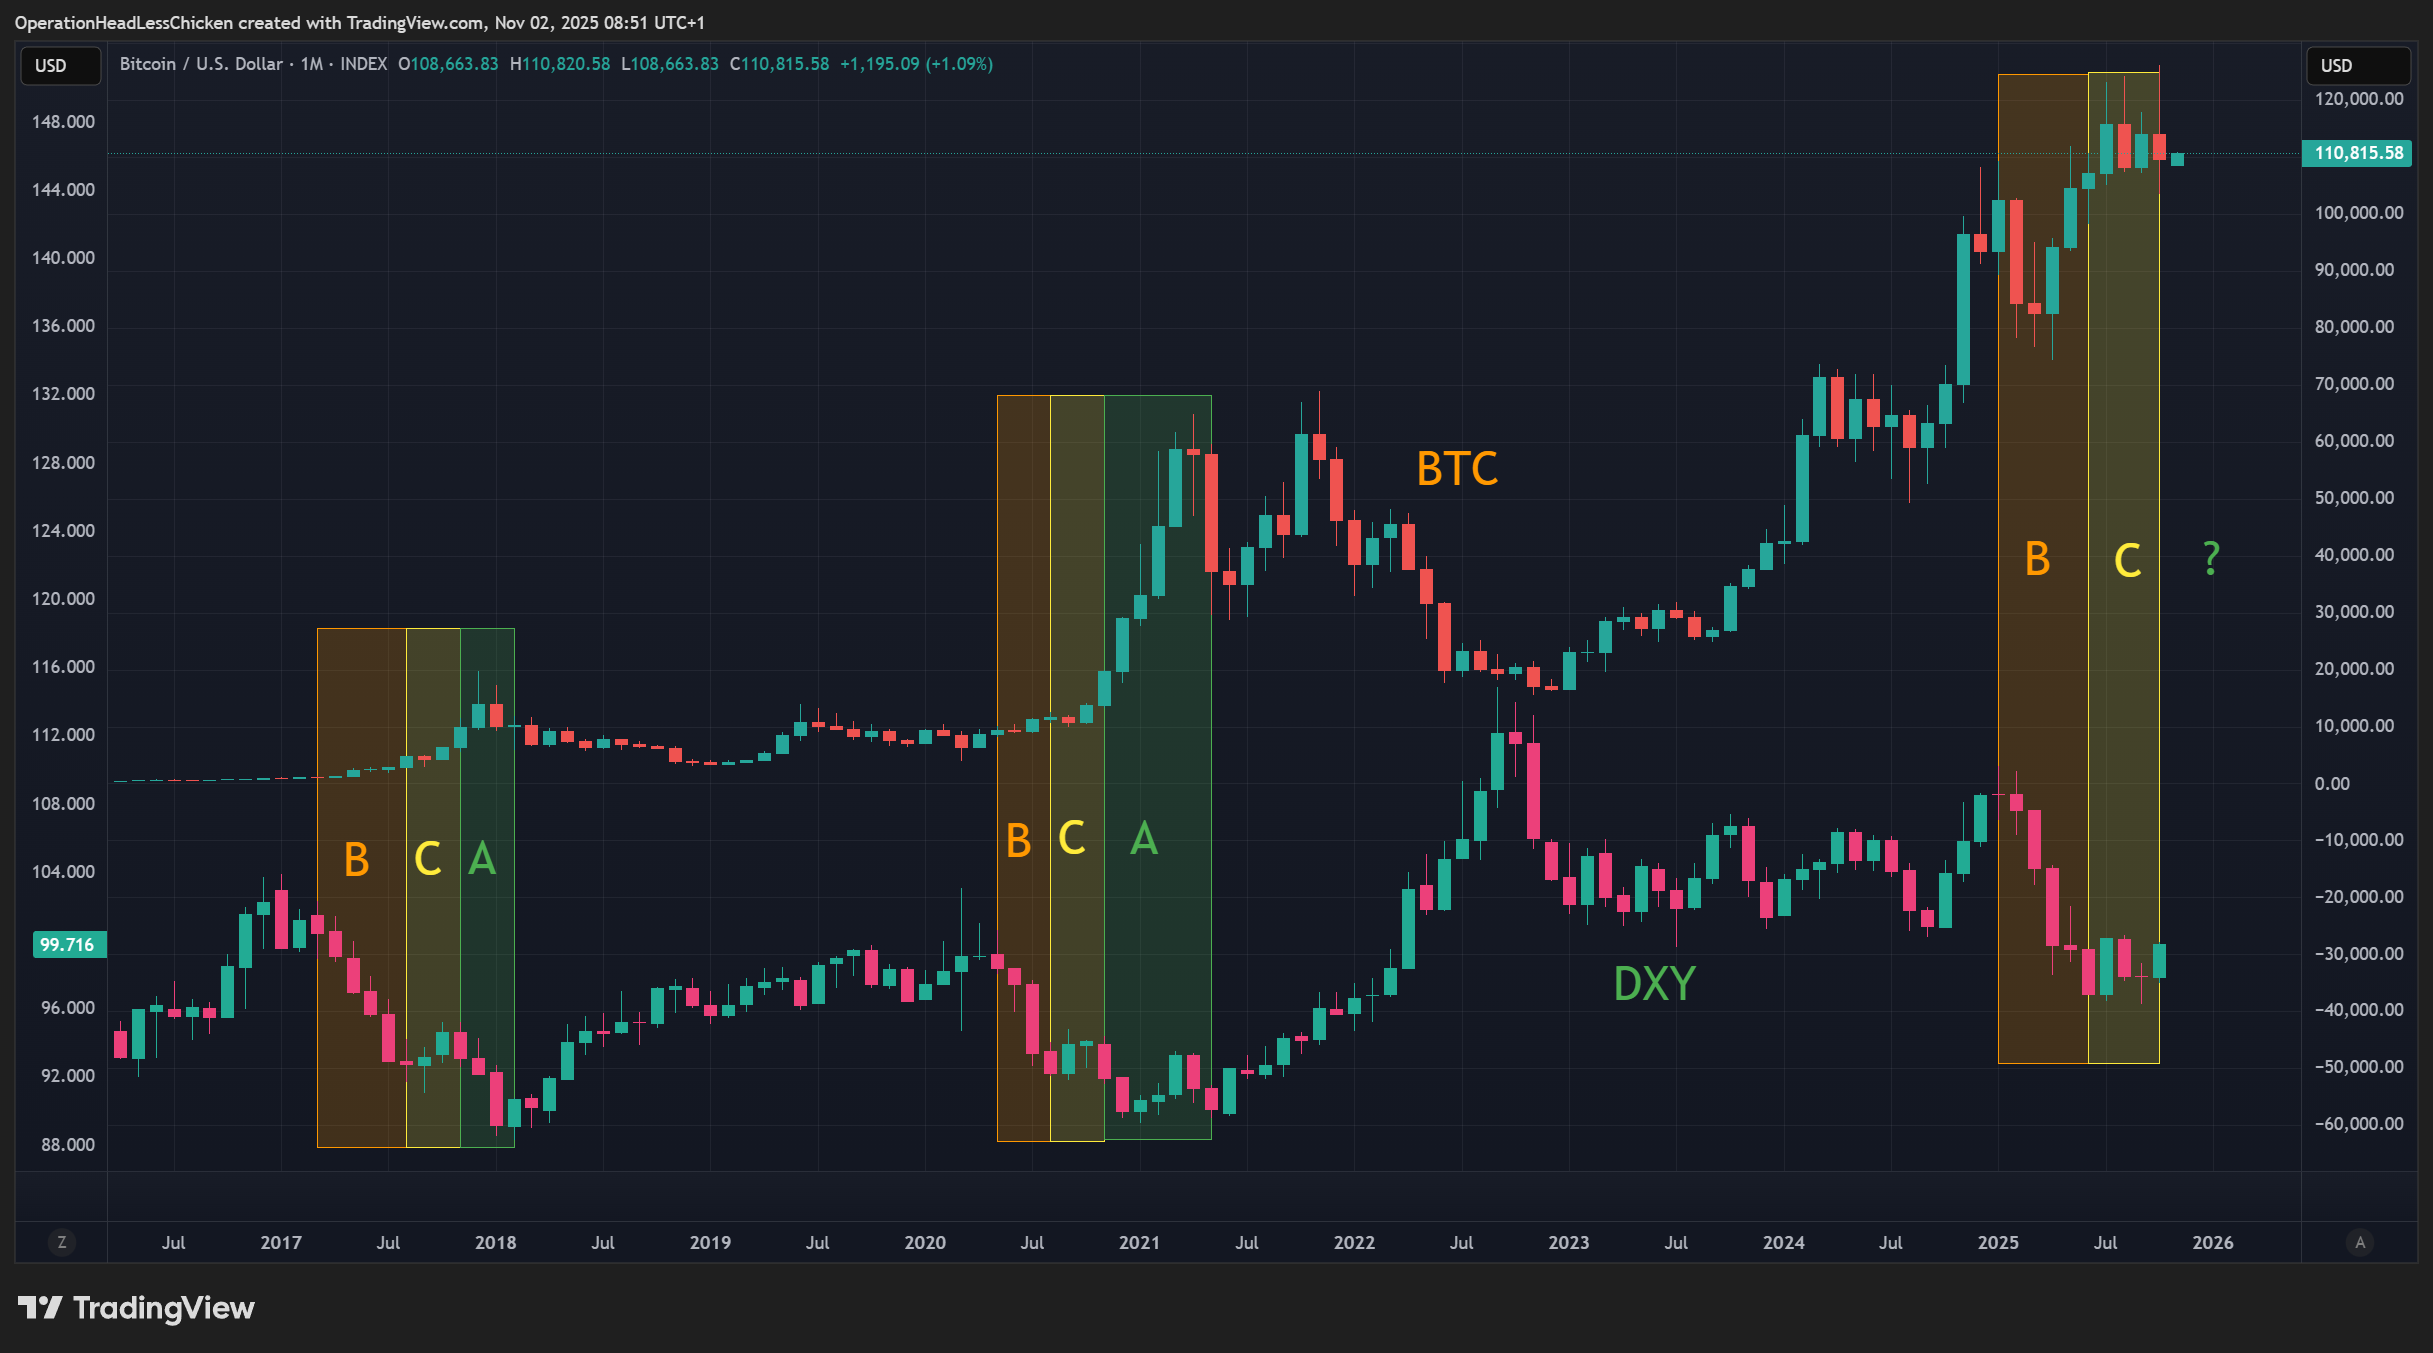
Figure 1: BTC price and DXY, monthly
There is the question mark: will there be an altseason this time? The current situation is:
- February-June 2025: we had the first big drop in DXY, BTC went up. This is good.
- Since July 2025: DXY has been chopping. A bit longer than usual.
- October 2025: DXY closed a relatively strong green candle. (Last candle on the bottom chart in Figure 1) If DXY goes up from here, it can cancel the altcoin season.
2.1.1.2 What moves the DXY?
Usually macro catalysts, including but not limited to:
- Strong
EURand/orJPY-> lower DXY - US inflation data: lower -> lower DXY
- US unemployment data: higher -> lower DXY
- US Federal Reserve (Fed) interest rates: lower -> lower DXY
And vice versa for the above.
The DXY tends to fall after US government shutdowns. There was a shutdown in October 2025.
Tip: Since we are focusing on Q4 in the relatively short term, it is advisable to watch the DXY on shorter time frames, like the daily or 4h.
2.2 Crypto indicators
In this section, I will discuss indicators that are focused on the broad crypto market. All of them include Bitcoin (BTC) in one way or another, since BTC is so influential on the whole crypto market.
2.2.1 BTC Dominance
Let’s start with the most important one. BTC Dominance or BTC.D for short, which is also the symbol used by TradingView. It is the ratio between BTC's market capitalisation (market cap) and TOTAL, the market cap of the total crypto market.
At the time of writing, BTC.D is at 60.01%, which means that BTC gives 60% of the total crypto market cap, while all the other coins (including stablecoins) give 40% together. Do you still wonder why BTC is referred to as The King? :P
BTC.D is useful to assess where capital is flowing within the crypto market:
- When BTC.D is rising, the market favours BTC
- When falling, the market prefers altcoins or stablecoins
There are some caveats though:
New token launches,airdropsandunlockscan swell the altcoin side of the equation without any rotation out of BTC: new supply and altcoin market cap is just added overnightBTC supplycreeps higher with block rewards: much more gradual process than token unlocksLiquidity: BTC doesn’t notice 1 million dollars in price, meanwhile a small altcoin very much doesStablecoins: crypto’s fastest growing sector, currently at315.5 BUSD. When USDT or USDC expands its supply, BTC.D can shrink, even if no-one is buying into alts
2.2.1.1 BTC dominance in past cycles
Every major altseason paired with a massive slide in BTC.D, not just a drop, see Figure 2 below:
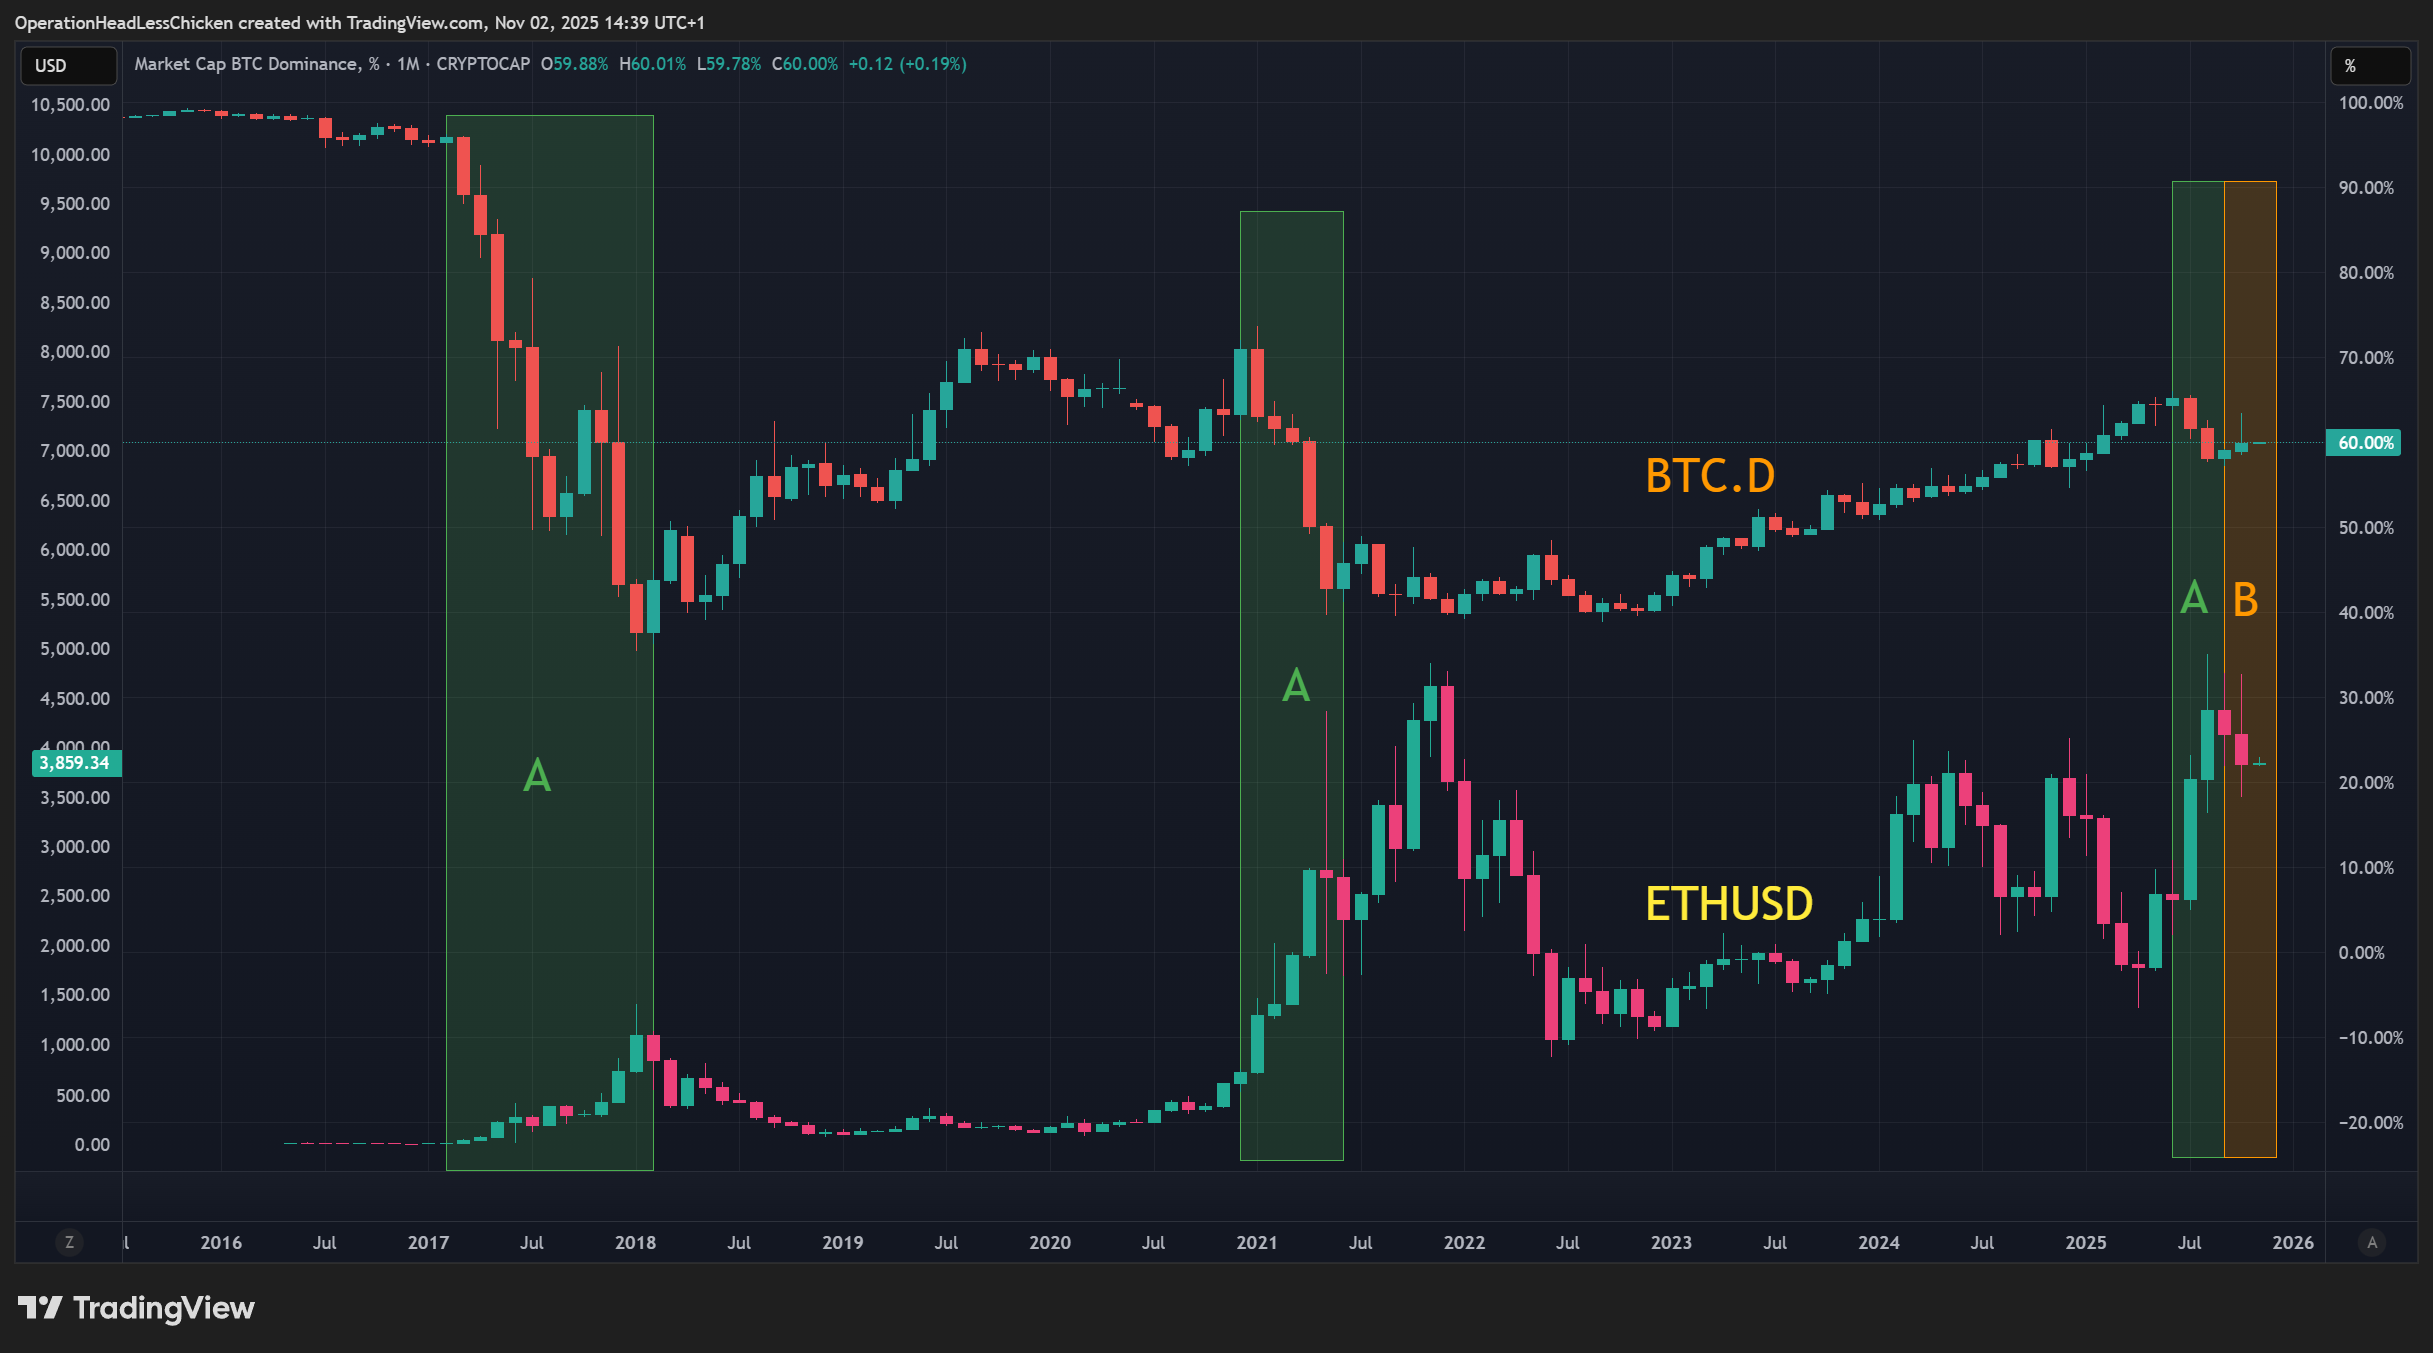
Figure 2: BTC dominance and ETHUSD, monthly
In Figure 2 I used Ethereum-USD (ETHUSD) to illustrate the altcoin behaviour in relation to BTC.D’s movement. Altseasons are marked with A.
- January 2017:
95%->37%: in one year. This was the first altcoin season in history, withInitial Coin Offering (ICO) boomandETH,XRP, and thousands of other altcoins’ price skyrocketing. In Figure 2, ETH’s price went from 15 USD to 1100 USD - 2021 from February to May:
62%->42%: it also coincided with an altseason, where ETH rose from737 USDto4380 USD. - July, August 2025:
66%->58%: it suggested that alts were waking up, and ETH did rise significantly (2485 USD->4956 USDAll-Time High (ATH)) during this period. In hindsight though, it was just a mini-altseason, followed by a correction inBTC.D(marked withBin Figure 2). As you can see, this does not favour alts.
Right now, we are in this indecisive phase marked with B. And this aligns with what we have seen in the DXY section (marked with ?).
2.2.1.2 Important levels
Historically, when BTC.D reached the following levels, it had a significant impact on the altcoin market:
- Mid 50s (marked with
50sand yellow rectangles in Figure 3): dominance has the tendency to chop around here, while more capital flows into altcoins. First step towards an altseason, if ETH is getting up to speed. “Altseason is loading” - Around 40 (marked with
40and magenta rectangles in Figure 3): Second step, strong altcoin momentum, real fireworks!- 2017-18 and 2021 alt peaks, see ETH’s chart for the fireworks.
- This time, we are still quite far from
40%. BTC.D is sitting at60%
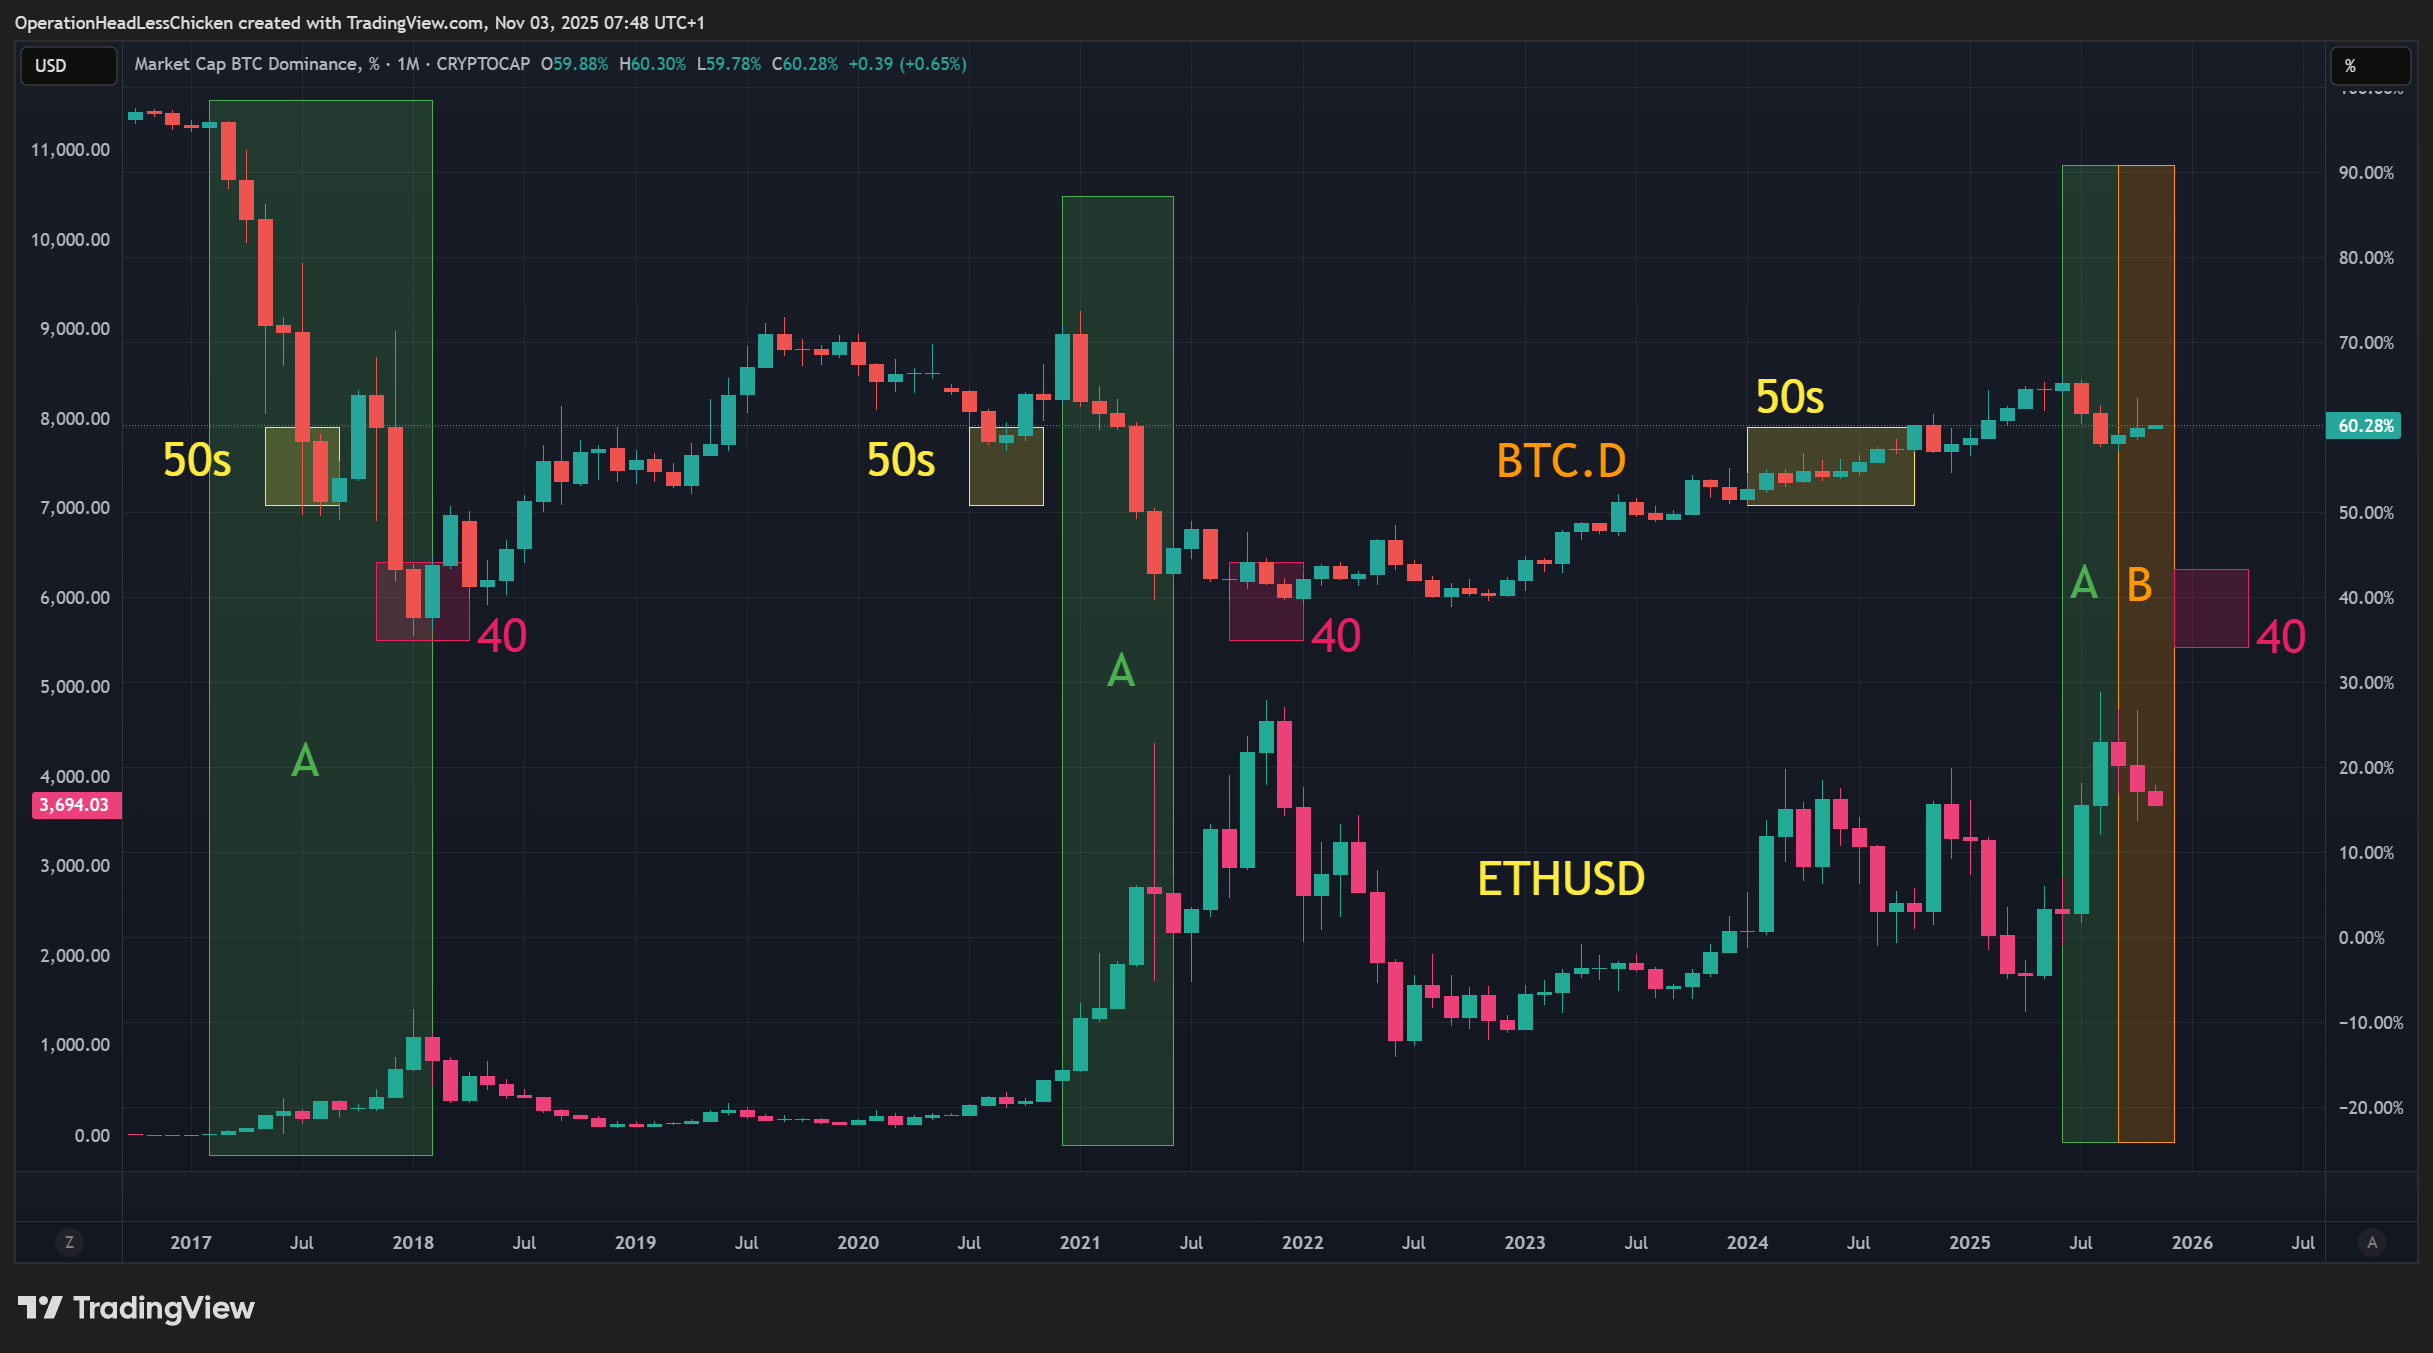
Figure 3: BTC dominance and ETHUSD, monthly
When BTC.D breaks down properly, capital flows as follows:
ETHstarts moving first,- Then other large altcoins,
- Then mid and small caps,
- And finally the truly degenerate stuff
2.2.1.3 What influences BTC.D?
As we have seen earlier, BTC.D is the ratio between BTC's total market cap and the total crypto market cap, so changes in either term will shift the ratio:
- In favour of BTC:
- Spot BTC
Exchange-Traded Funds (ETF) inflows - Corporate BTC buying (Strategy (MSTR) and others)
- Spot BTC
- In favour of alts:
- Spot ETH ETFs
- ETF treasuries
- Token unlocks on alts
- Stable coin minting
- Both ways:
Risk-on/risk-offcycles. BTC is considered crypto’s safe haven. Investors run to BTC in risk-off periods, and move into alts when they have greater appetite for risk.
-> ETH rising is good for the broader altcoin market
-> As we have seen earlier, there are many different reasons that can cause BTC.D to move. Luckily, there are some useful complementary metrics that can help you determine which one it is:
2.2.1.4 Complementary metrics
These metrics can help you understand what moves BTC.D behind the scenes.
2.2.1.4.1 TOTAL
The total market cap of the top 125 cryptos: swells when fresh money floods in (prices rise), shrinks when the whole market deflates. Let’s have a look at how we can interpret BTC.D and TOTAL together:
BTC.D down,TOTAL up: new capital or recycled BTC gains are moving towards altsBTC.D down,TOTAL flat: Money moves from BTC to larger alts, without growing the total market capBoth up: capital is pouring into the market so fast that BTC’s share can still growBTC.D up,TOTAL down: classic risk-off situation: traders are selling alts harder than BTC
These are important signals, that the market is shifting, but they don’t need immediate action. Stay calm and have a plan. BTC.D helps you stay oriented, when the noise is getting loud
If you are heavy on BTC, it doesn’t mean that you have to sell it and buy alts immediately. BTC.D falling means that the environment shifts from single leader to multi-leader (BTC can still rise together with the others). You can take different paths, all are valid, and have their tradeoffs:
- Stay full BTC
- Con: can feel slow when alts are skyrocketing
- Pro: being stuck in illiquid coins can be brutal if
BTC.Dbounces back, which tends to happen even in altcoin season
- More balanced approach:
rotate a portion of BTCto a few coins you have researched.
2.2.1.4.2 TOTAL2
Excludes BTC from TOTAL.
- OTHERS
up, butTOTAL2 is rising more: rally is focused on ETH and a few other large caps
2.2.1.4.3 TOTAL2ES
Similar to TOTAL2, but excludes stablecoins as well: total market cap of altcoins that can rally in an altseason without BTC and stablecoins. ES stands for Excluding Stablecoins.
2.2.1.4.4 OTHERS
Removes top 10 and USDT, USDC from TOTAL: mid and small caps: this is the market segment that can skyrocket at the peak of the altseason
OTHERS up,BTC.D down: mid and small caps are rising
2.2.1.4.5 STABLE.C
Total Stablecoins Market Cap. Currently at 313 B USD.
- This is dry powder waiting to be deployed in the market -> a growing stable market cap is bullish
- Stables are mostly used on Decentralised Exchanges (DEX)
2.2.1.4.6 Large cap-BTC pairs: ETHBTC, SOLBTC
ETH and SOL* play the same role in BTC.D as the EUR and JPY in the DXY. They are the heaviest counterweights on the scale.
As we have seen earlier, in an altseason, ETH starts moving first, then other large caps. Therefore, keeping an eye on ETHBTC and SOLBTC can give you an early clue that the alt sector is waking up.
*: At the time of writing, XRP and BNB have larger market caps than SOL, but the point is the same: just replace SOLBTC with the actual largest cap coins for your analysis.
3 Conclusion
In this post, we have discussed the DXY, which is a macro indicator measuring the US Dollar’s strength on the global market, and Bitcoin dominance which is the most important indicator focusing on the crypto sector. These are the highest level indicators you should watch to get a sense of the global markets.
In the next post we will take one step down in our top-down hierarchy and have a look at the Pi Cycle Top and MVRV Z-score, which are more Bitcoin-specific, but can still provide valuable information about the crypto sector as a whole. Stay tuned! :)
4 Glossary
- Alts: Altcoins, alternative coins, all cryptos except BTC
- ATH: All-Time High
- BTC: Bitcoin
- DEX: Decentralised Exchange
- DXY: US Dollar Index
- ETF: Exchange-Traded Fund
- ETH: Ethereum
- EUR: Euro
- Fed: US Federal Reserve, central bank of the United States
- JPY: Japanese Yen
- MSTR: Strategy’s stock ticker (formerly known as MicroStrategy)
5 Links and further reading
- Part 1: Puell Multiple and Its Improvements
- Part 2: Bitcoin Price Prediction
- Part 4: Pi Cycle Top and MVRV Z-score
- Part 5: The Versatile Technical Indicators!
- Part 6: Indicator Cheat Sheet
Comments