Smart Money Concepts - Part 1: Fair Value Gaps
Disclaimer: Nothing in this post should be taken as financial advice. Trading involves risk, and you are solely responsible for your own decisions and potential losses.
Introduction
This post is the first part of a series on Smart Money Concepts (SMC). Throughout the series I will go into more details about how the institutions hunt down retail traders and how you can take advantage of it, even if it sounds strange.
I will present several examples to demonstrate market situations. I will always describe only one direction of the trade (long/buy/bullish or short/sell/bearish) to keep it concise, but you can always apply the same concept for the opposite direction too, even if I don’t mention it explicitly.
Also, I assume that you are familiar with basic trading concepts, such as candlestick charts, common indicators, position management, Take Profit (TP) and Stop Loss (SL) orders. If you are not, I will leave some links for you in Links and further reading.
Lastly, there will be a Glossary at the end of each post, so you can look up abbreviations if you need.
Fair Value Gaps
In this part, I will discuss Fair Value Gaps (FVG), which is more of a trading psychology topic, but you will see how it relates to SMC in the following parts.
Fair Value Gaps (FVGs) form, when there is a sudden increase (or decrease - remember, I won’t point out both directions all the time) in the price of an asset. This is usually due to market imbalance. One side is much stronger, e.g. there are many buyers, but no sellers. At the new elevated price, buyers don’t want to buy any more, so sellers have to lower the price until there are buyers willing to buy again.
The fair price is the price at which most of the exchanges would take place as both sides (buyers and sellers) are comfortable to do business. In other words, the market is in balance. FVGs are areas of inefficiency where price moved too quickly, leaving untraded zones between candles.
FVGs on candlestick charts
You can recognise FVGs on the chart by looking for large bodied candles that have little to no wicks (so called Marubozus). They indicate strong market momentum dominated by one side. For example:
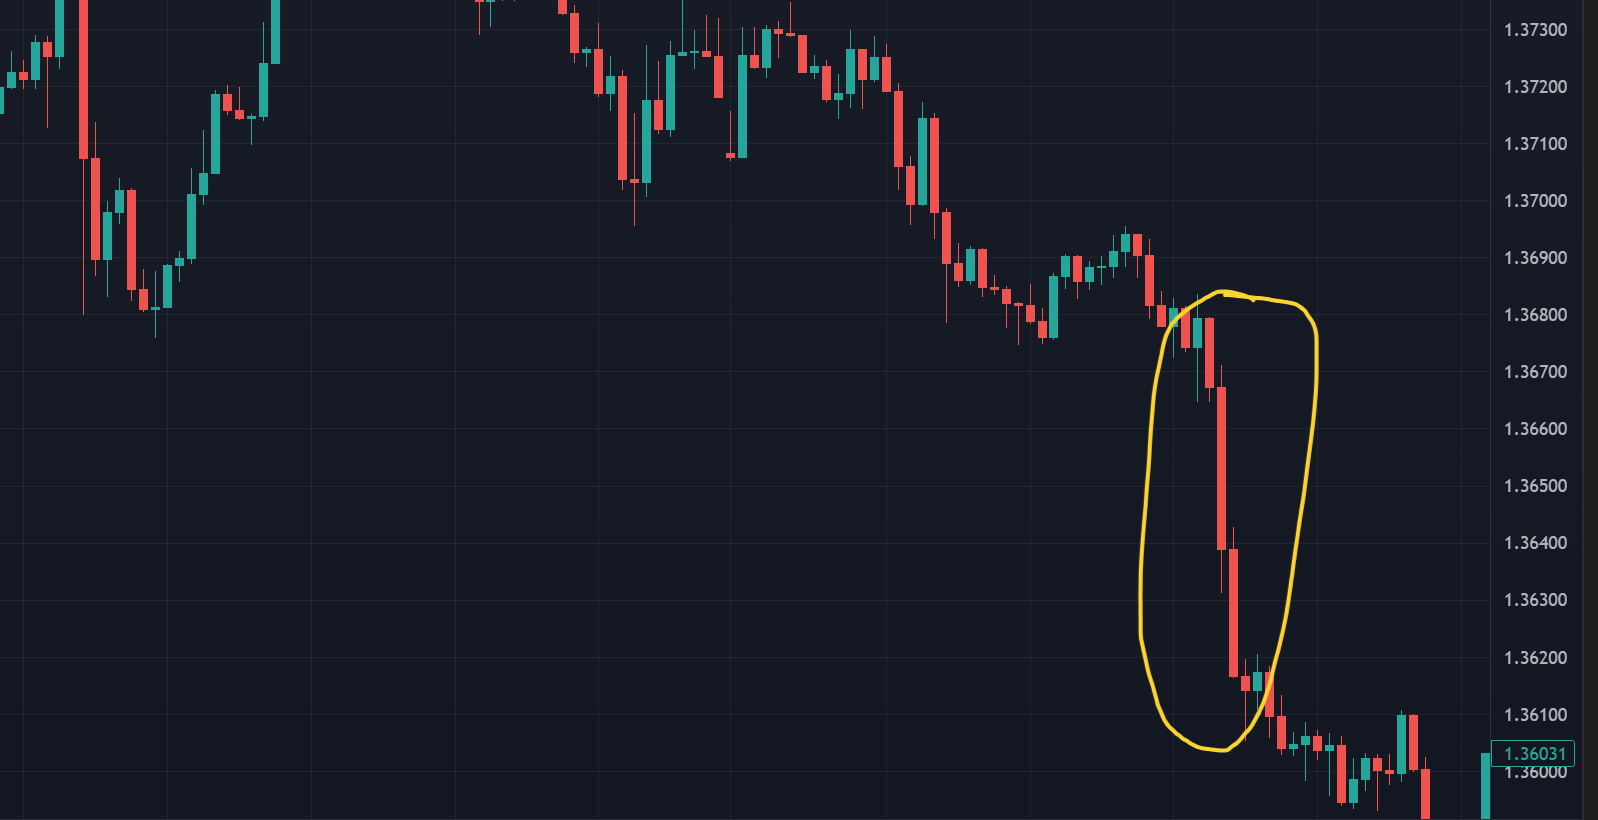
Figure 1: Bearish Marubozu candles on USDCAD 1h
Perfect, textbook Marubozus don’t have wicks, but this is rarely the case in real life. They usually have small wicks compared to their bodies. Those wicks suggest that in that zone there has been some trading activity already (the opposite side stepped in a bit), but the rest of the bodies are untouched territories, which we are most interested in.
Drawing Fair Value Gaps
When drawing the FVG of a Marubozu candle, you subtract the next candle’s wick from its body, see Figure 2 below.
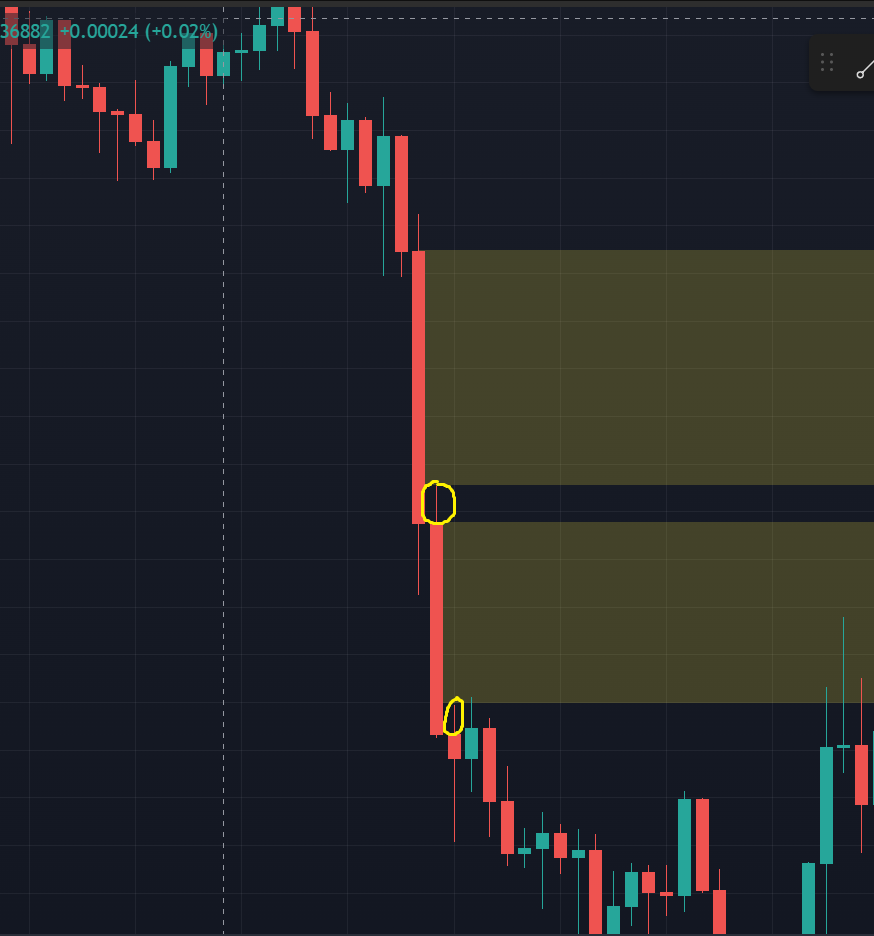
Figure 2: Drawing the FVGs
There is also a stricter way to draw. In this case you subtract the wick of the previous candle as well, because it indicates that there has been trading activity at that level already, see Figure 3.
None of these approaches are wrong. In trading, usually stricter (more conservative) approaches yield less, but higher quality trades. There is always a tradeoff between quality and quantity, and you have to experiment and see what yields better results in the long run.
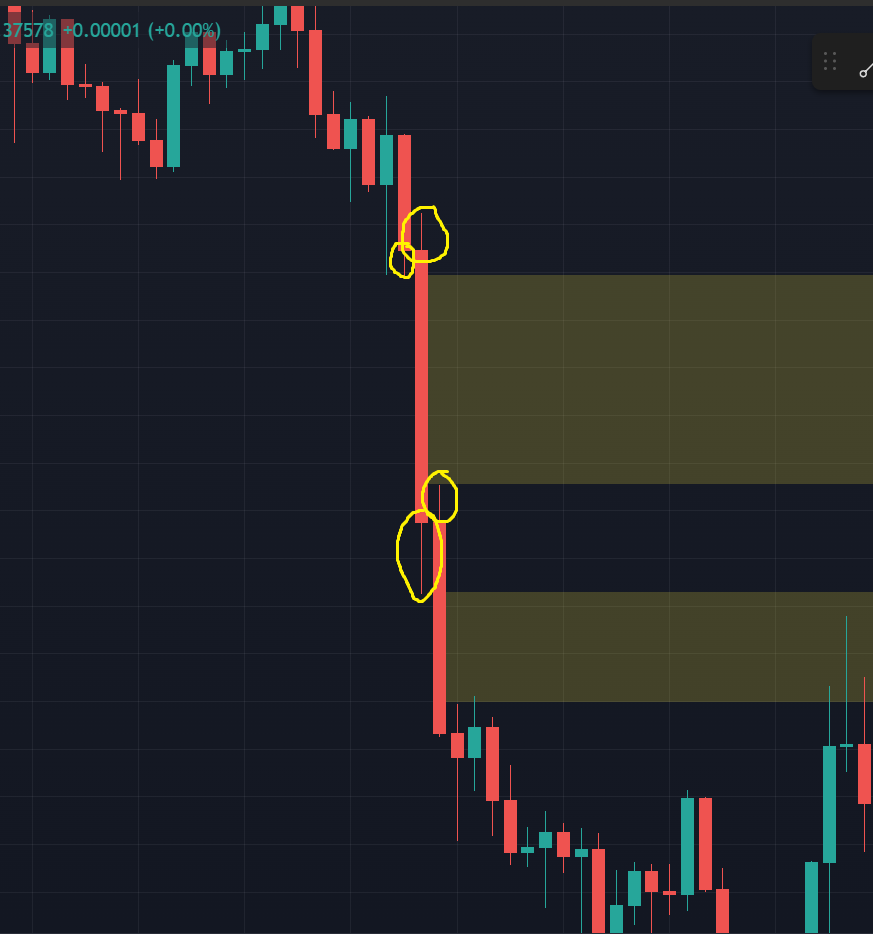
Figure 3: Drawing the FVGs, stricter approach
The FVGs lie to the right of the candle, because we are interested in the future, not so much in the past. Or are we?
Weakening factors
In fact, we cannot ignore the past completely, when determining FVGs. In Figure 1, you can see that the Marubozu candles break down to a territory where the price hasn’t been lately. This means that traders are not used to this price level, and the sellers will consider the price too low to sell. This makes it more likely that the FVG will be filled in, because buyers will have to offer higher prices if they want to find sellers to buy from. This is a very nice and clean setup.
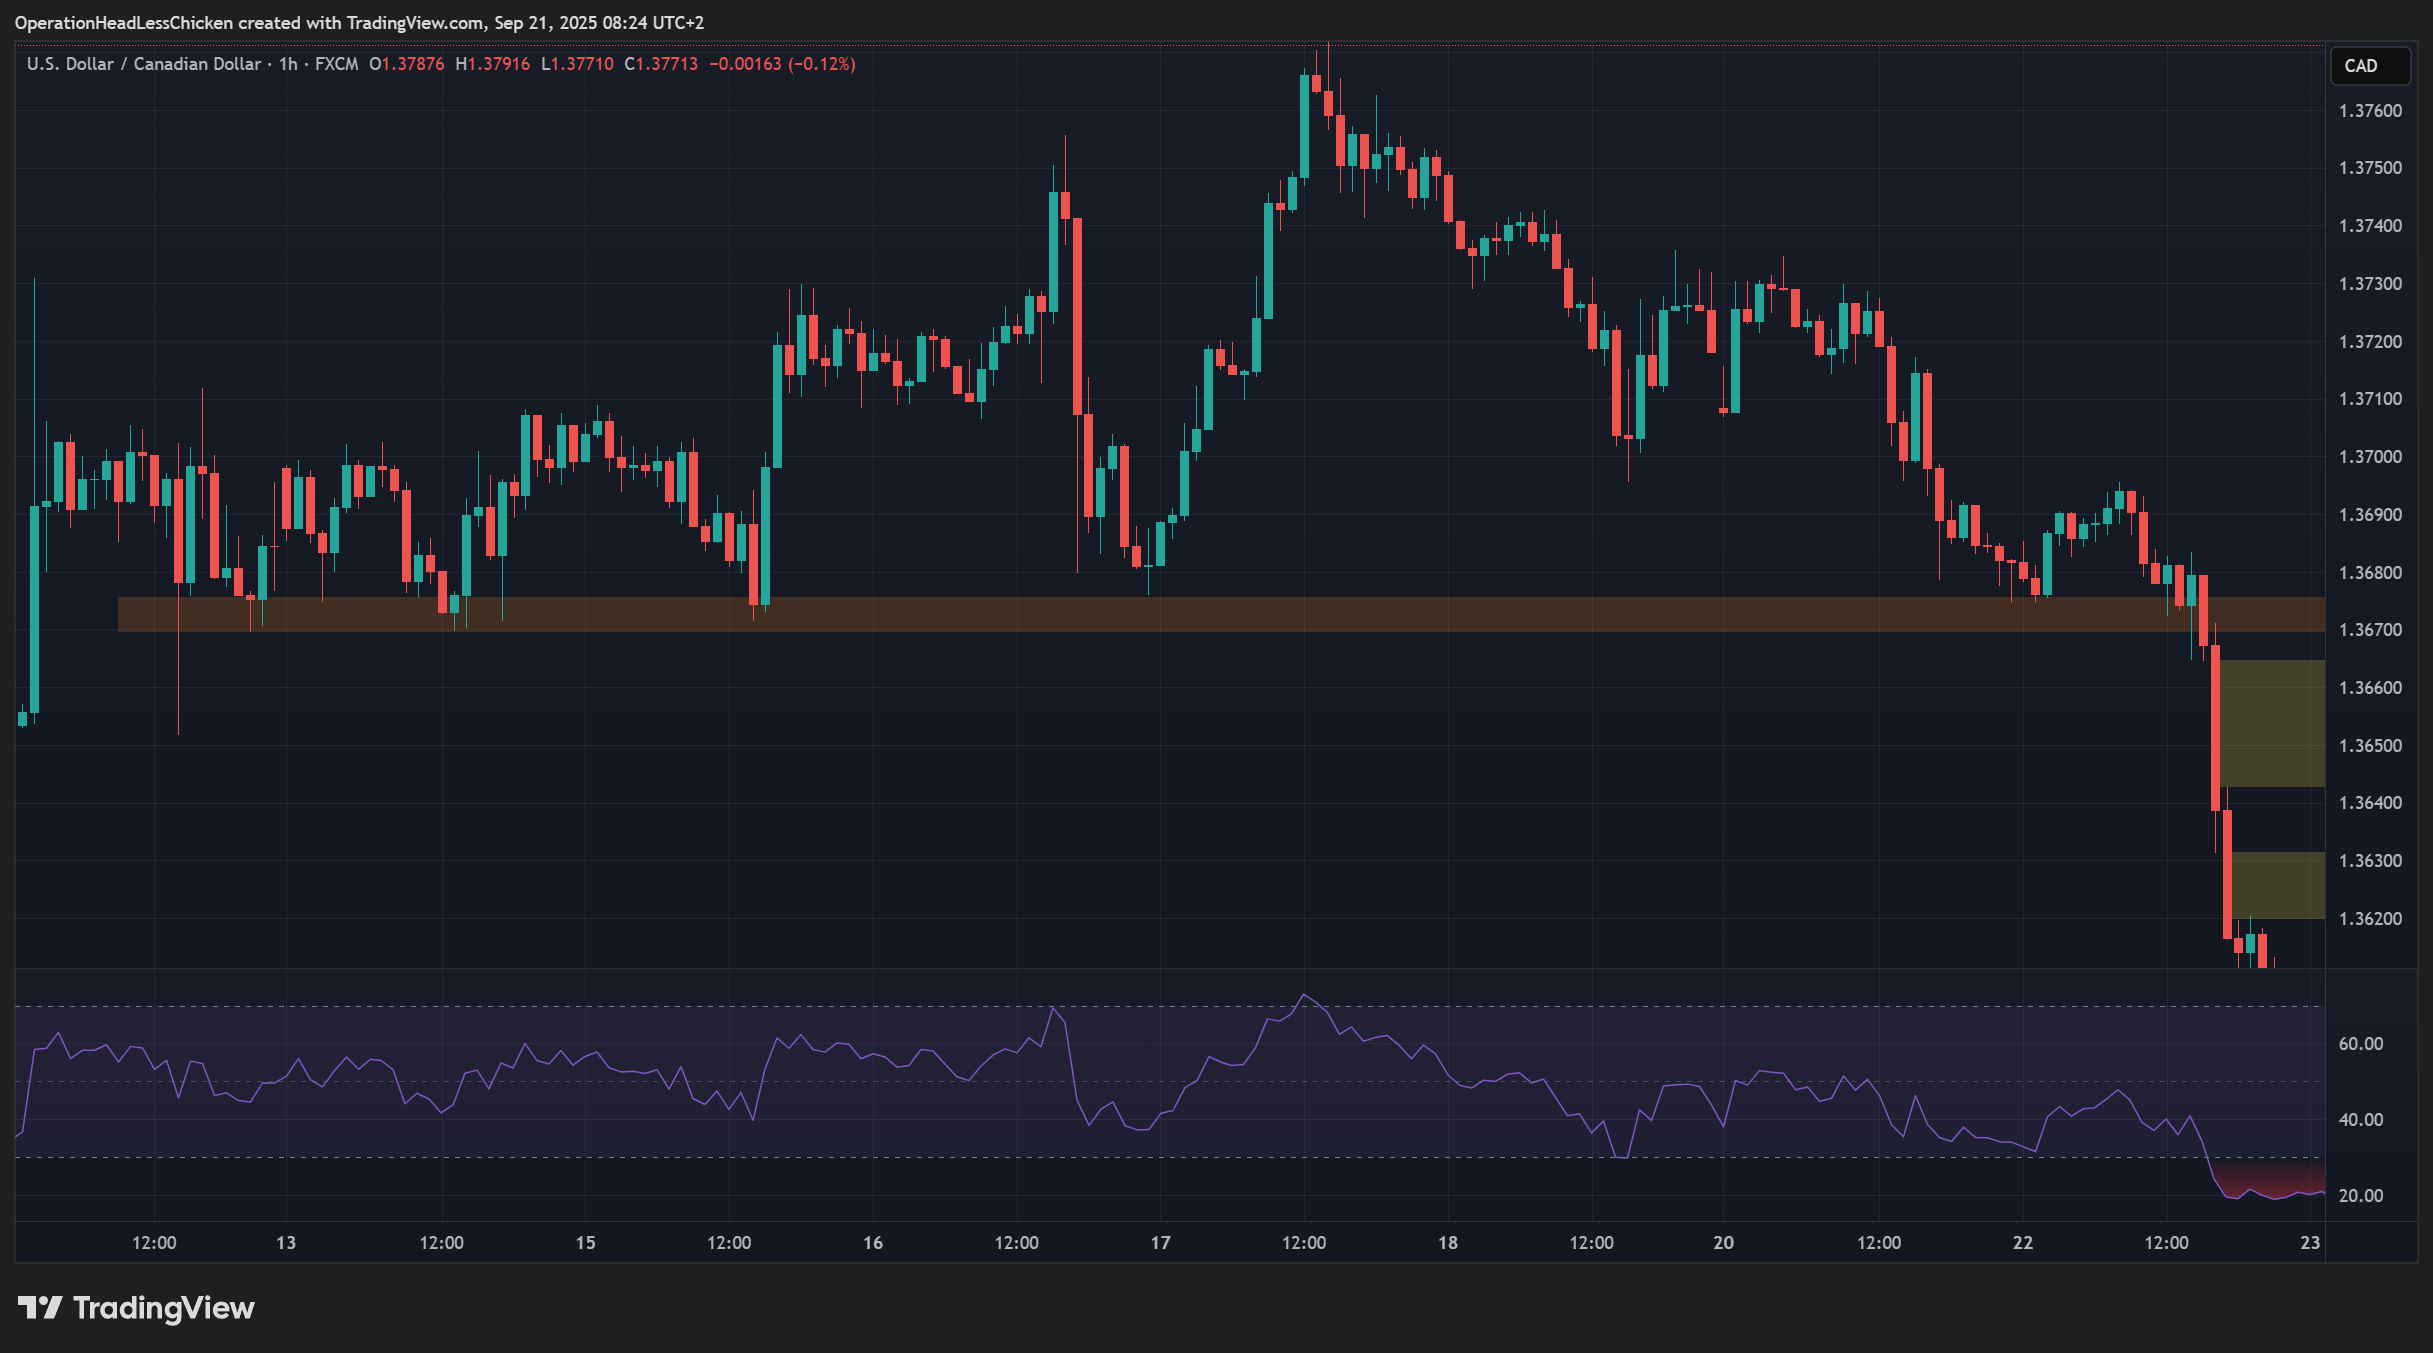
Figure 4: Clean FVG and oversold RSI
In Figure 4 above, you can also see that the breakdown is paired with an oversold Relative Strength Index (RSI) (I used the common 14 setting for the RSI, and also depicted the broken support zone around 1.367). More on the RSI in Relationship to indicators/RSI.
Now that you have seen a very nice and clean FVG setup, let’s take a look at some counter-examples.
1. Counter-example 1
In Figure 5 below, you can see the same chart example as in Figure 4, but a little earlier, before the big breakdown.
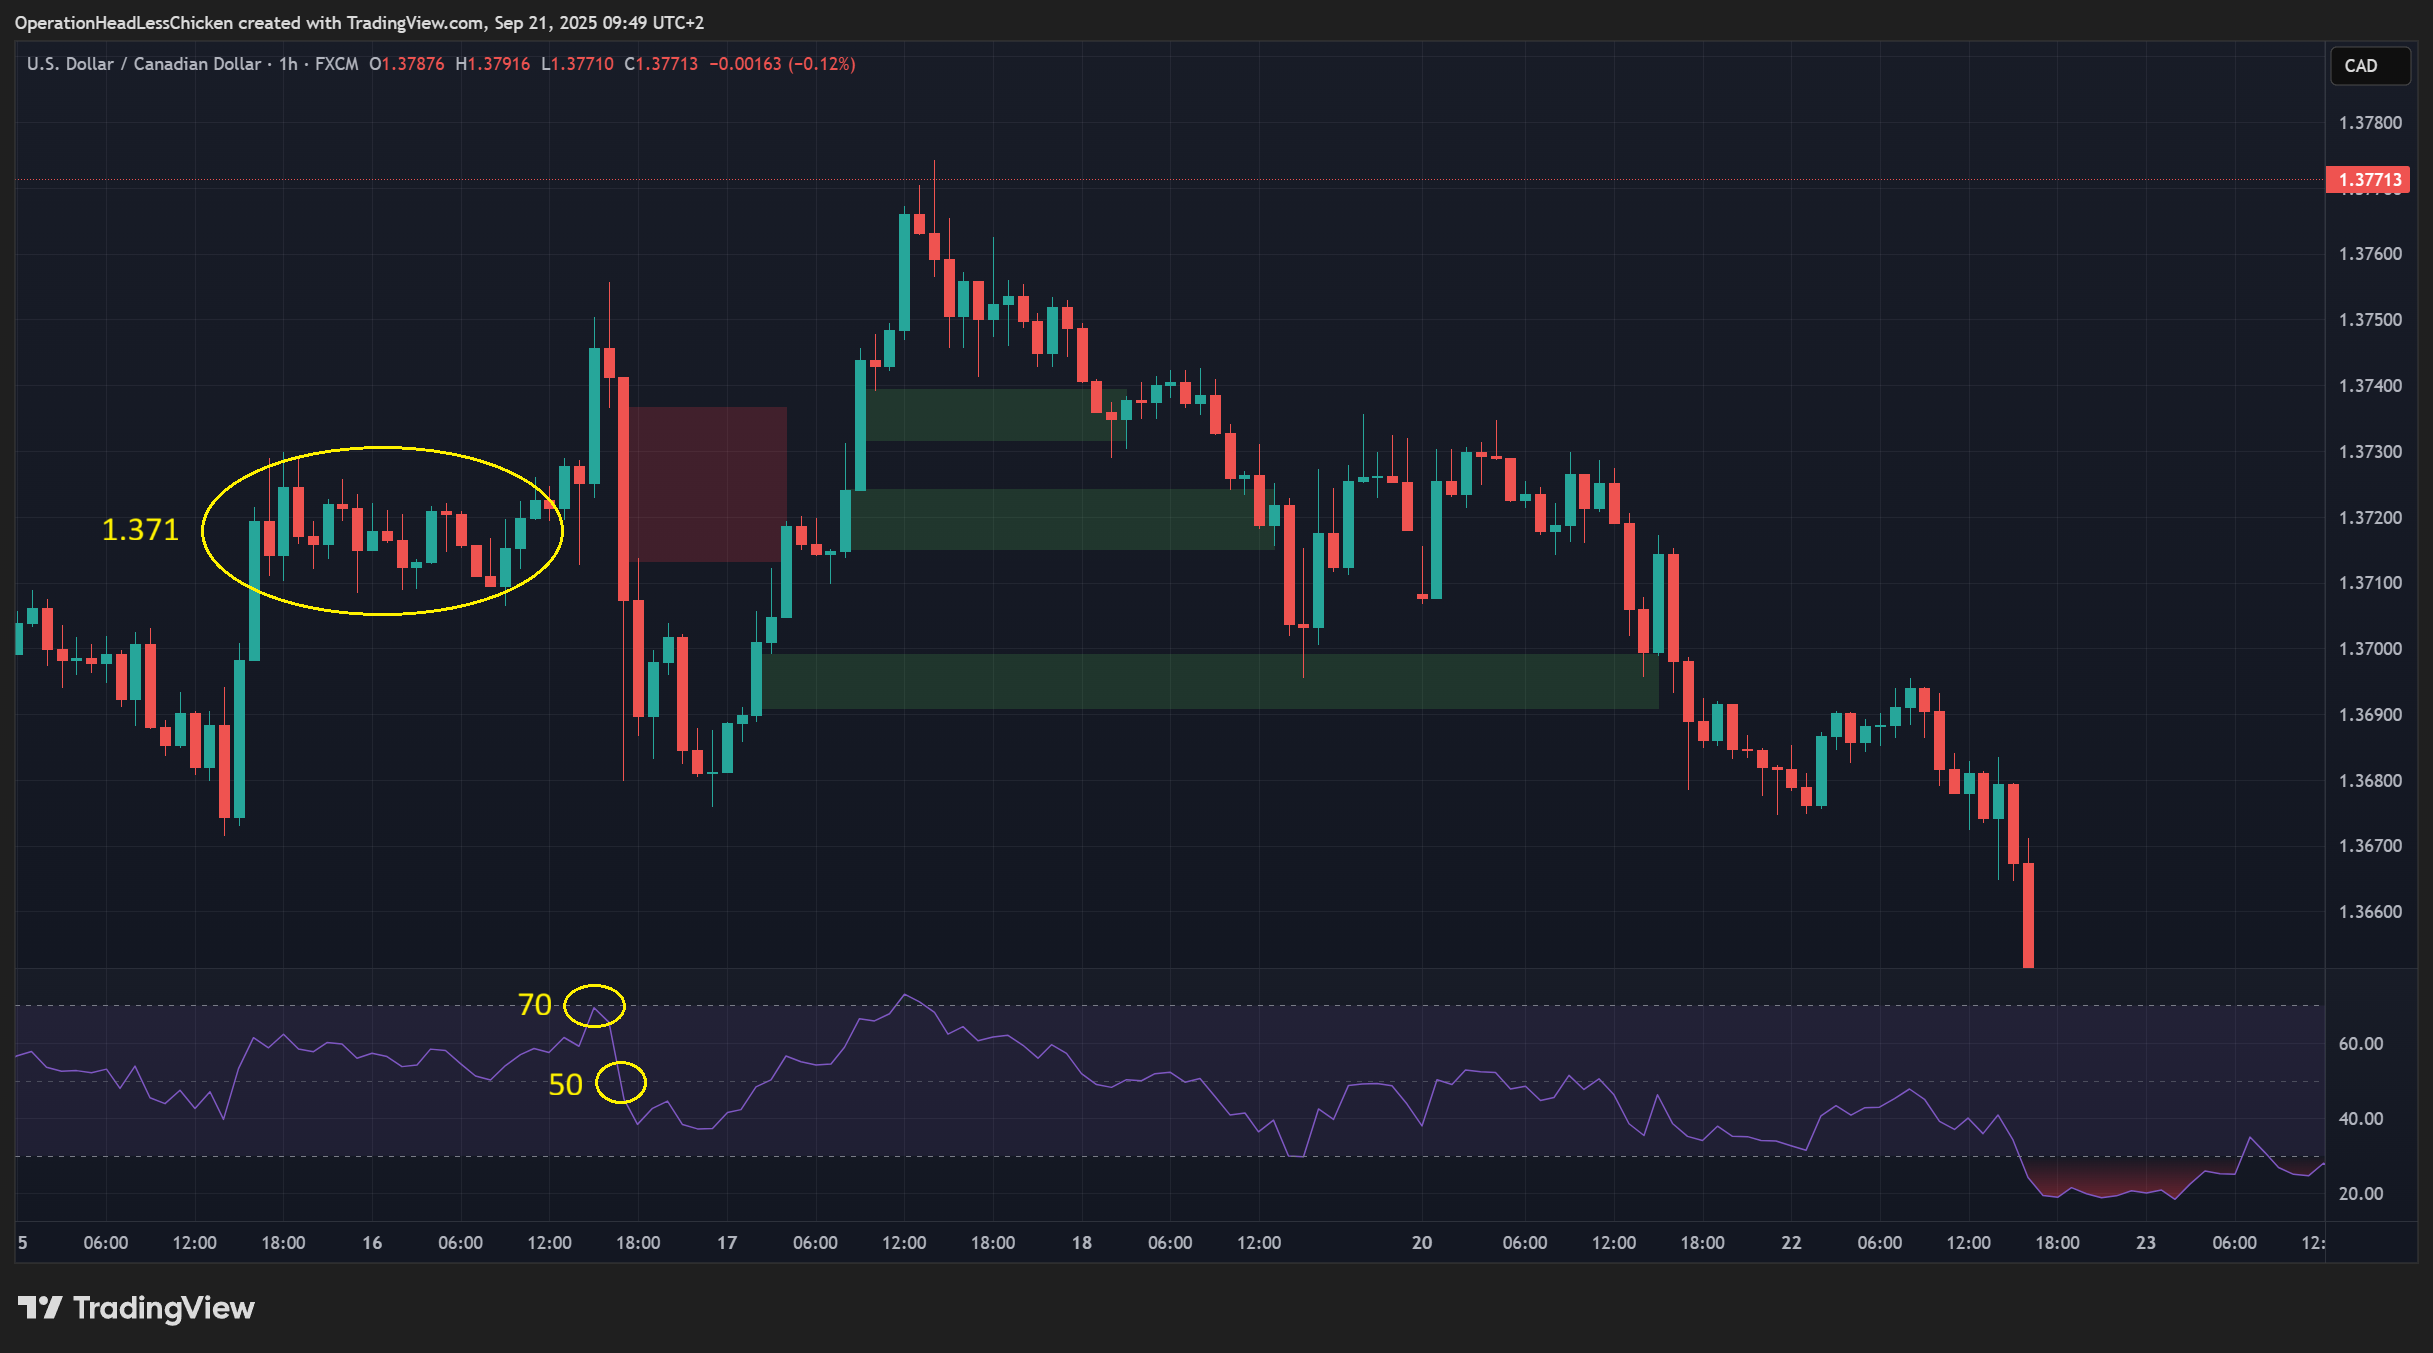
Figure 5: Counter-example 1
Here, the red zone induced by the big red Marubozu looks like a perfect FVG at the first glance, but in reality, it is much weaker. Notice the prior chopping price action to the left around 1.371. This means that even after the big drop, we are still at price levels that the traders are used to. We just got back to the balance price. This is also confirmed by the RSI, which touched 70 before dropping back to 50, which is as neutral as it gets. Nothing crazy or extraordinary here, we are in balance. This is not a good setup for trading. We want imbalanced situations to enter trades, because there, the likelihood for the price to pull back to balance is greater.
The same applies to the green zones. Even though their Marubozus and the zones themselves look good, they do not break into previously uncharted territories. You could still consider these valid FVGs, but they are much weaker setups.
2. Counter-example 2
In our second example (Figure 6), the green Marubozus indicate some decent FVGs. They are still not as clean as in Figure 4, but they are good enough to explain the next concept.
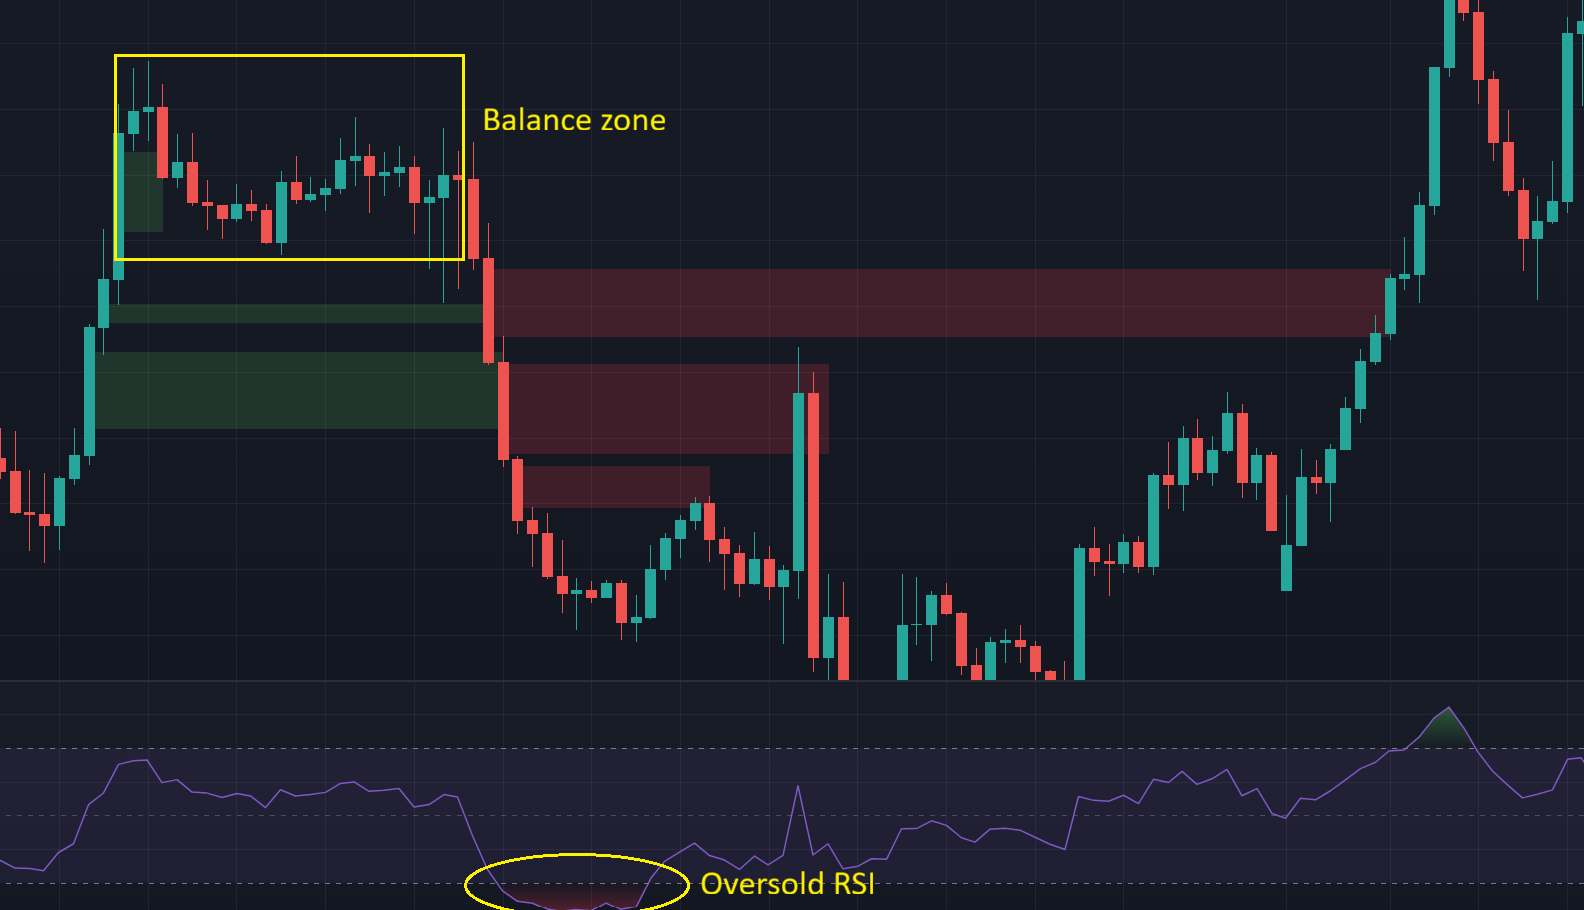
Figure 6: Counter-example 2
The red zones indicated by the red Marubozus also look like pretty good FVGs:
- The Marubozus are large, drawing nice wide zones.
- The price hasn’t been at these levels lately. The green Marubozus on the left were 26 candles ago, which is a decent distance already (remember, the RSI uses the default period of 14)
- Between the green upleg and red downleg, there has been
sideways choppingfor 22 bars which indicates market balance - We have broken down from the balance point
- RSI turned oversold.
Everything looks good. What is wrong then?
The problem is that the red Marubozus fill the FVGs opened by the green ones. Thus we view them as closing existing FVGs, rather than opening new ones. You could still treat those red zones as FVGs, but they will never be as strong as freshly opened ones. If you think from the market psychology perspective: FVGs mean that the price got too far from the balance price and there is a "tension" (imbalance) in the market. The Marubozus in the opposite direction just release this "tension" bringing back the price to balance. Weak setup again, I would avoid trading the red zones.
Special case: “physical” gaps
You might have heard about “gaps”. In foreign exchange (Forex), they usually form over the weekend, because trading activity is paused and the opening price on Monday can differ from the closing price on Friday. These gaps are quite easy to spot, see below:
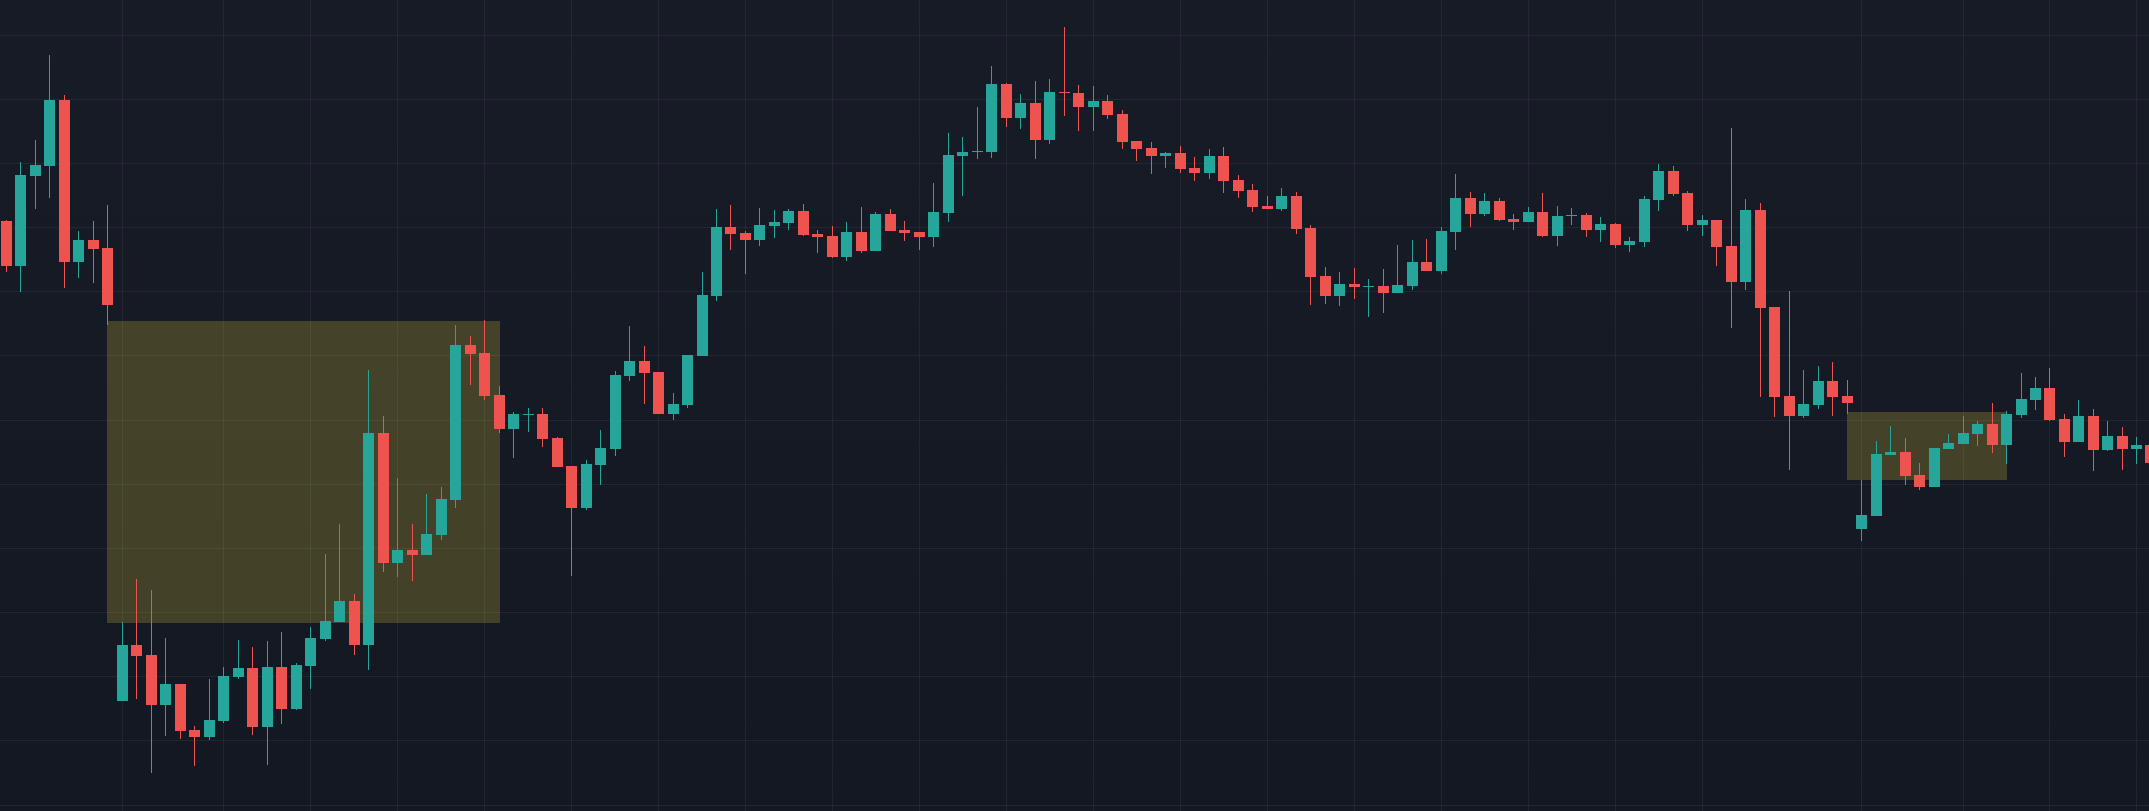
Figure 7: Weekend gaps EURUSD 1h, 2025-01-30, 2025-02-07
In Figure 7, you can see two weekend gaps following each other on two consecutive weekends. As you can see, the price filled both quite convincingly. These “physical” gaps behave similarly to FVGs and can be traded with the same logic as “regular” FVGs. If anything, they seem even stronger setups.
Relationship to indicators
SMC trading doesn’t prohibit the use of indicators, and it is useful to see the relationship between price, market psychology and indicators. You don’t want to trade indicators without understanding its underlying mechanics, and you should always use them in context. That is the difference between retail style trading and applying SMC. So let’s have a look at two indicators whose mechanics are closely related to FVGs.
Relative Strength Index (RSI)
The first one is the RSI, which I have already mentioned in connection with Figure 4, our textbook example. As we have seen already, when an FVG forms, the price gets away from the balance price with a strong momentum. This is often reflected by the RSI, because it can go to oversold (below 30) or overbought (above 70) territory. What follows, usually sooner than later, is an RSI pullback, which often coincides with FVG fills, since both reflect rebalancing. Now you can see the real mechanics behind the RSI, and why and how it works.
You don’t have to use the RSI to identify FVGs, but it can give you a nice extra confirmation, if you like.
Volume Profile (VP)
In Figure 8 below, you can see the Volume Profile (VP) indicator put on a chart. The area between the two blue horizontal lines is called the Value Area. This area shows where the bulk of the trading activity has happened over a given number of last bars. These parameters can be changed. I used the default setting of 68 and 200, which means that 68% of the trading volume has happened in this area over the past 200 bars (default settings).
The red line is called the Point of Control (PoC) which indicates the price level with the highest trading volume in the given period (longest horizontal bar on the right). This is the same as our balance price, just put in another way. You can think about this level as the opposite of an FVG. It acts like a gravitational point that keeps pulling the price back towards itself.
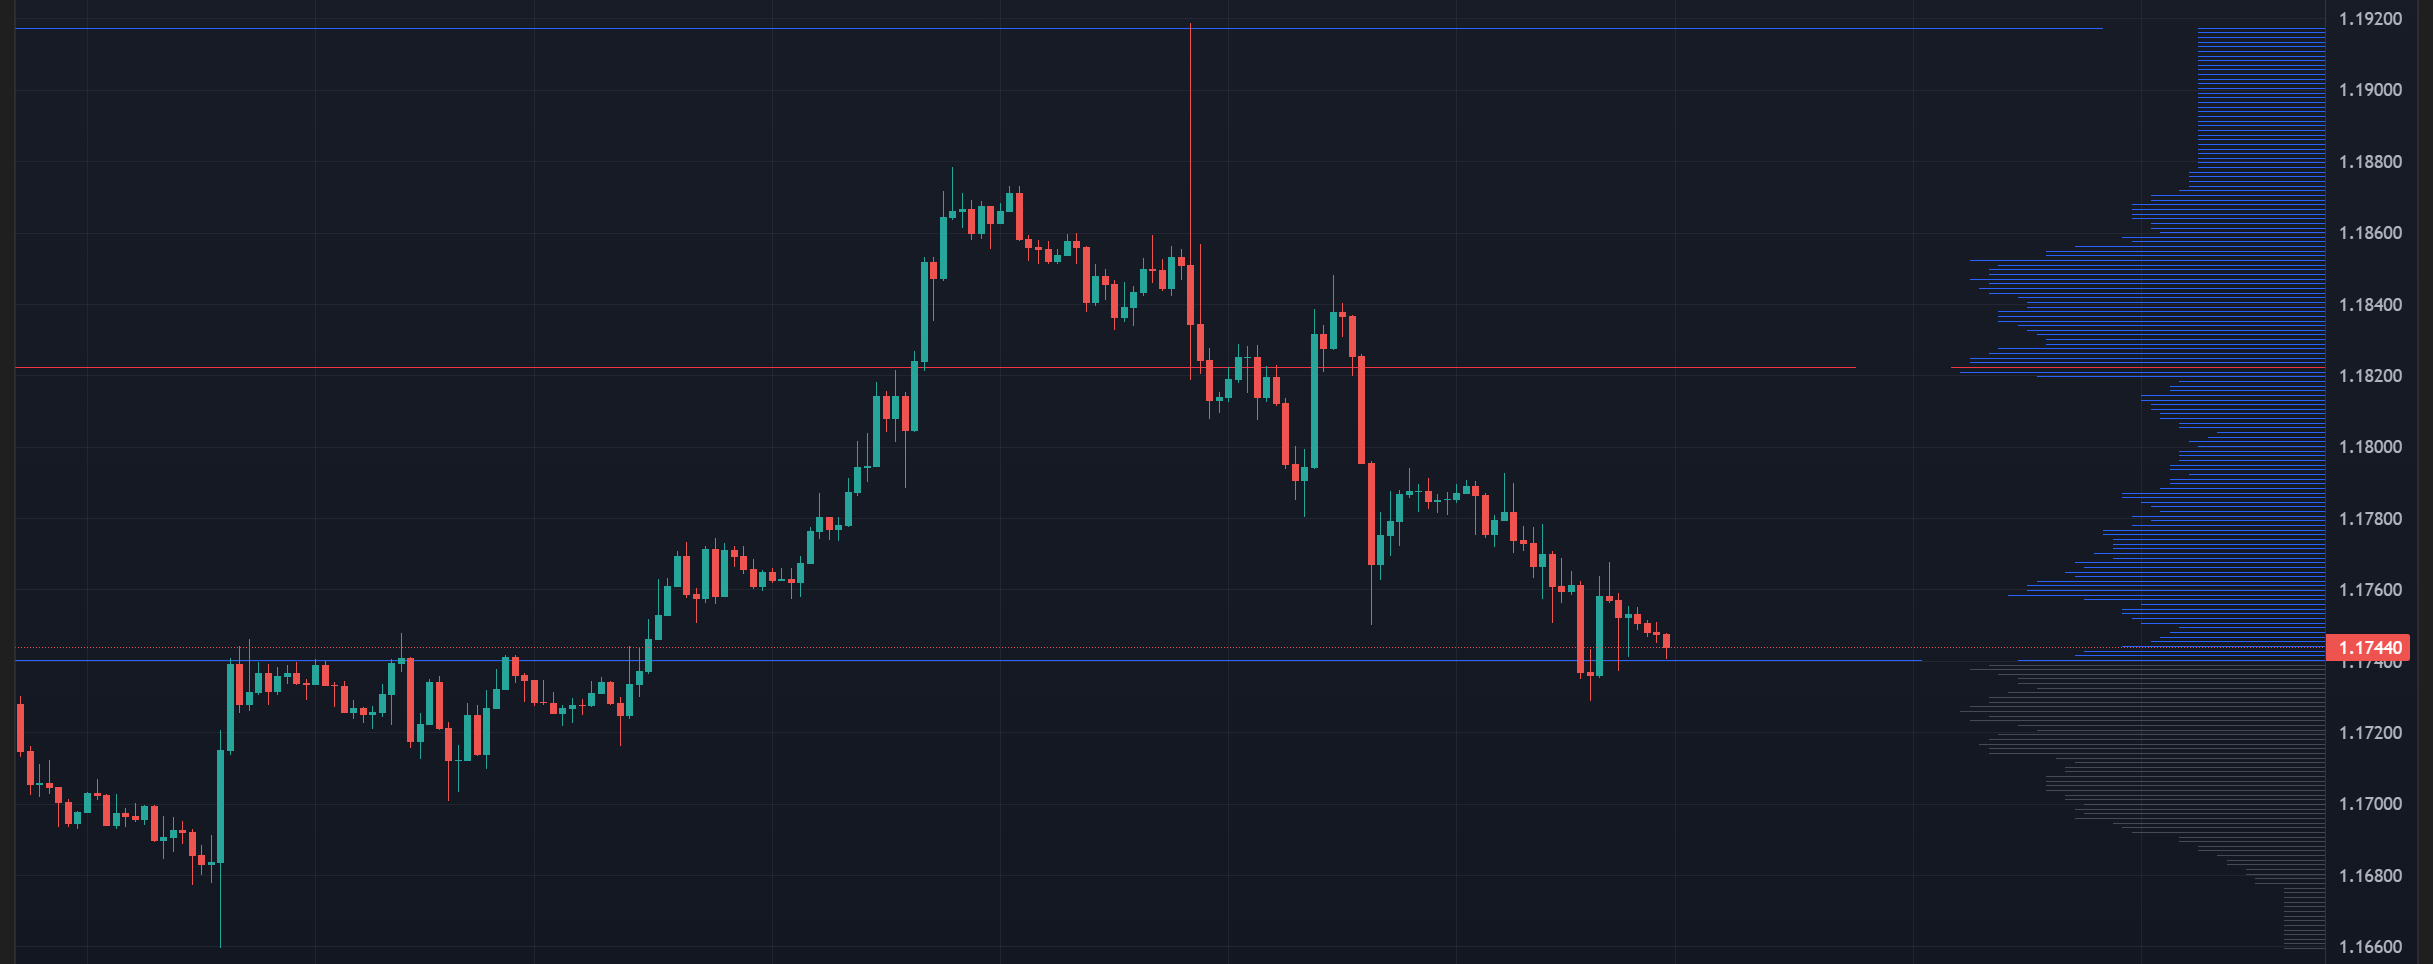
Figure 8: Volume Profile EURUSD 1h
We expect FVGs to form away from the gravitational point, the further the better. We need the market to move in order to trade successfully. Up or down, it doesn’t matter, we can profit from both directions, but not from sideways chopping.
The further we are from the gravitational point, the more likely a return towards the PoC will occur, because the price cannot stretch forever (the buyers/sellers who have driven the price so far will run out of steam at some point). On the other hand, near the balance point, FVGs are less likely, and you can expect more sideways chopping which you cannot really trade. Better to stay away.
In extreme cases it is more likely for the chart to return to the balance point: notice the similarity to the RSI, which also tends to spend relatively little time in overbought/oversold territory and pull back to more neutral levels. Now you can see how all of market psychology, FVGs, the RSI and the VP are related to each other. Market psychology is the cause of all these mechanics, and the other three are measures and presents it in different ways.
Outroduction
In this post I have discussed
- What FVGs are, how they are created and the psychology that works behind the scenes
- I have also shown how to identify them on candlestick charts and two approaches to draw them
- Discussed what makes the best setups and what are the weakening factors to avoid
- Finally we had a look at how market psychology works as a
conductorwho makes the price action and indicatorsmove in unison
This wraps up the theory about FVGs. In the next post, I will show you different approaches of trading FVGs. Stay tuned.
Glossary
- Forex: foreign exchange
- FVG: Fair Value Gap
- RSI: Relative Strength Index (indicator)
- SMC: Smart Money Concepts
- PoC: Point of Control (see VP)
- VP: Volume Profile (indicator)
Comments