Disclaimer: I am not a trading expert. I am still learning these topics, and this post is a compilation of what I have learned so far.
Writing it helps me deepen and organise my knowledge, and I publish it in the hope that it will be useful for you as well.
Nothing in this post should be taken as financial advice. Trading involves risk, and you are solely responsible for your own decisions and potential
losses.
Introduction
There are so many indicators for the crypto market, and every crypto guru swears by different ones. It is just confusing! I am sure there are many different approaches that can work when it comes to long term investing in crypto assets, but one has to understand at least a few of the available indicators, narrow them down to even fewer and build a strategy on them. So I have decided to do my own research and document it. It feels like a bottomless rabbit hole!
Right off the bat, I have come across one that I have barely heard of: the Puell Multiple. I feel like I already got trapped in the rabbit hole, because I have spent more time on it than I should have, instead of exploring the broader indicator landscape, but here I am. In this post I will discuss what the Puell Multiple is, its strengths and weaknesses, custom variants that I have come up with to address those weaknesses and some experimental results. I will also make the Pine Script used in these experiments publicly available.
Puell Multiple basics
The Puell Multiple indicator shows Bitcoin (BTC) miner profitability. The miners are important actors in the Bitcoin economy. They are on the supply side of the market, and can have a significant impact on BTC’s price. However, they don’t control the market, instead, they are affected by it as well. Miner profitability depends on two factors:
- BTC’s price (in USD)
- Mining Difficulty. The more miners there are, the greater the difficulty is, because more miners have to share the same amount of reward.
There are two extreme cases that we are interested in:
- When miners run their operations at
very high profitlevels, they are likely to sell BTC to realise their gains, thus pushing price down. - When their profit is
very low or even negative, they struggle to maintain their operation. This usually happens when BTC’s price is low. This may force weaker miners to shut down their operations, which means less mining difficulty for the surviving ones. This is very similar how markets shake out weak/overleveraged traders, which leads to healthier market conditions and opens up the possibility for a market recovery.
In short: extremely high miner profitability may project a cooling off, while extremely low profitability may project a market recovery.
Puell Multiple indicator
This miner profitability is exactly what the Puell Multiple indicator shows. It was designed by David Puell in 2019 and it is calculated as [1]
\[\text{Puell Multiple} = \frac{ \text{R} }{ MA_{365}(R) }\]Where
\[\begin{align} &R = \text{Daily USD value of BTC issuance (block reward + fees)}\\\\ &MA_{365}(x) = \text{365-day Moving Average} \end{align}\]Which means that the indicator shows how the current miner revenue compares to the long term average, and it looks like this:
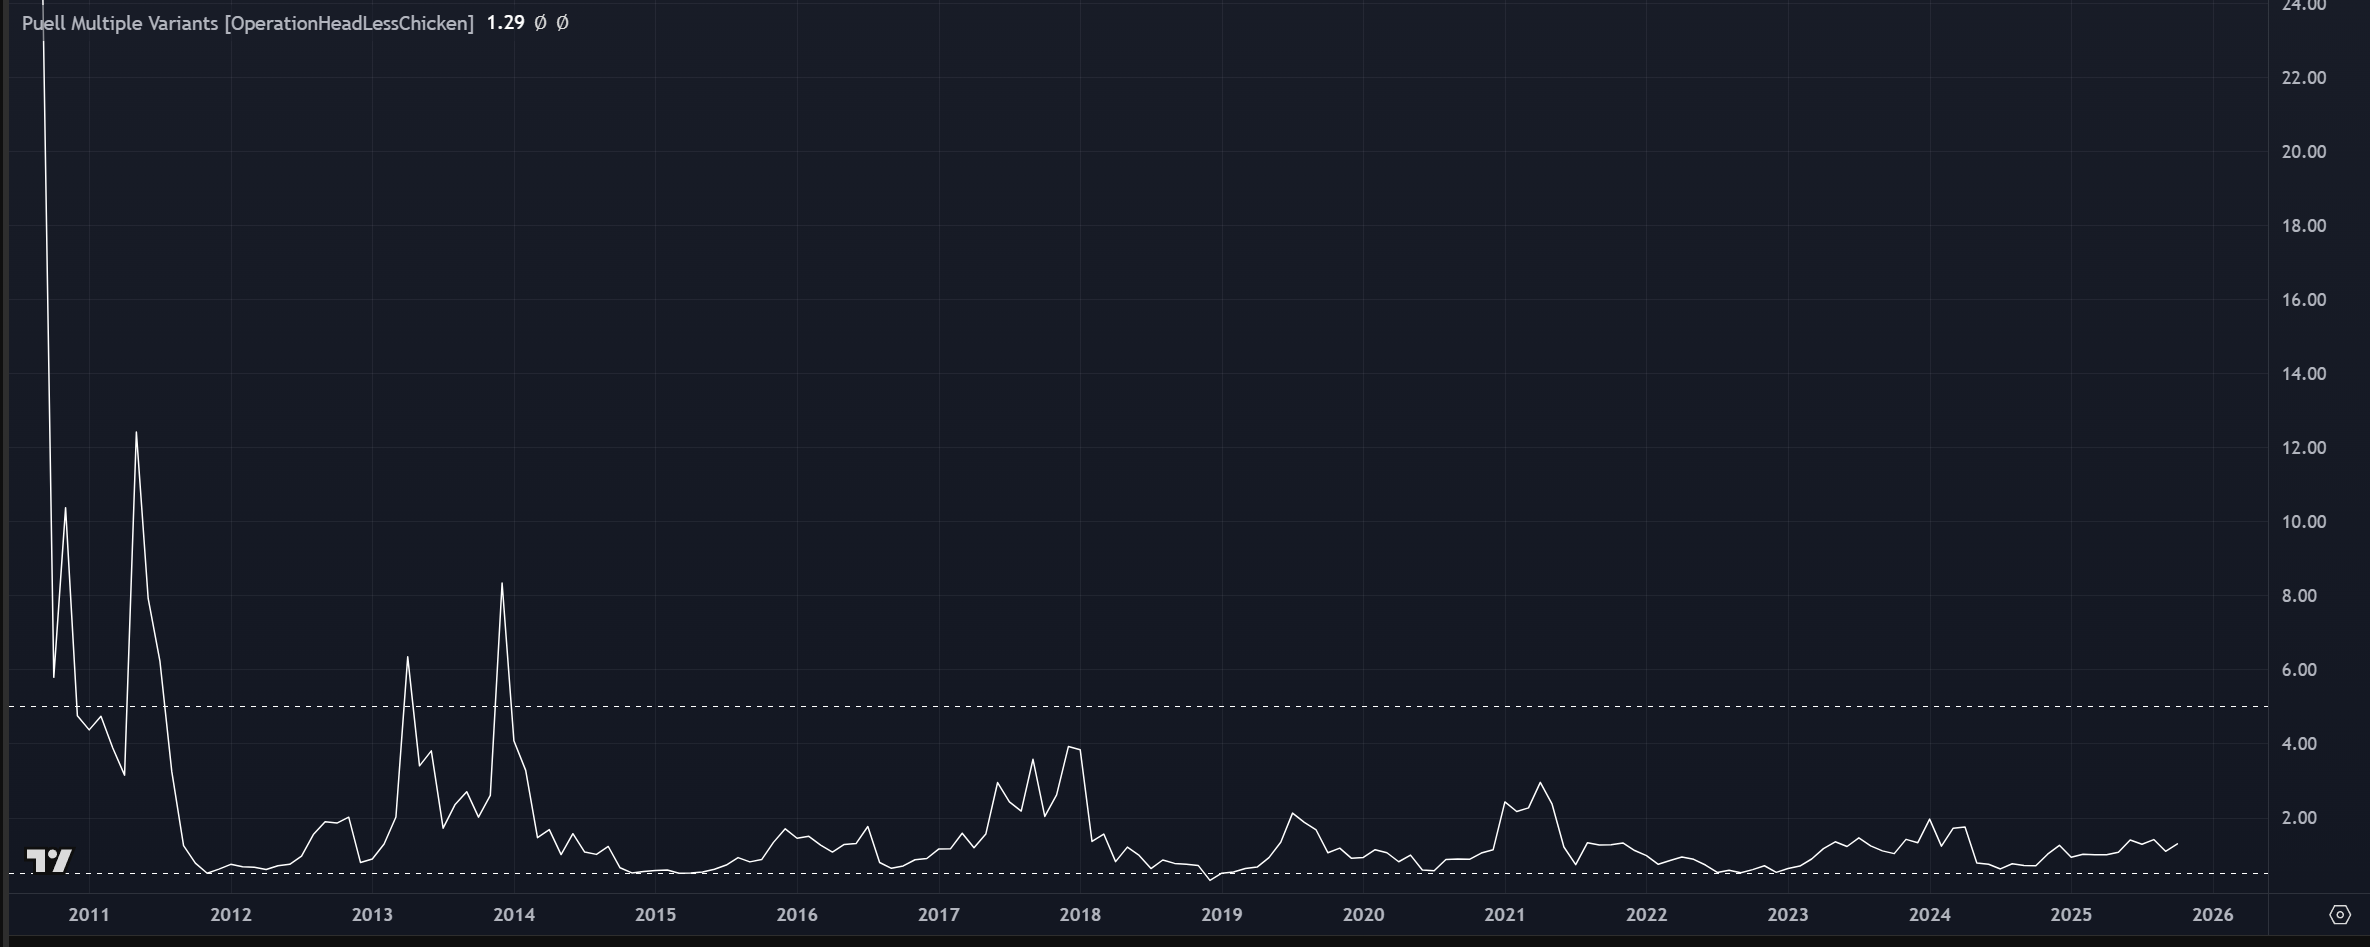
Figure 1: Puell Multiple plot
Bitcoin cycles
Before further analysing the Puell Multiple and what it suggests to us, we need to understand Bitcoin cycles as well.
Bitcoin, since its inception, has shown cyclic market behaviour which is heavily driven (although not exclusively) by its halving events. Halving events occur about every four years, and it halves the global BTC block reward for miners. It sounds quite bad for miners, but it also means, that less new BTC will enter the market, which eventually drives prices up. Now let’s take another look at the Puell Multiple chart with the halving events marked, using a logarithmic* scale this time:
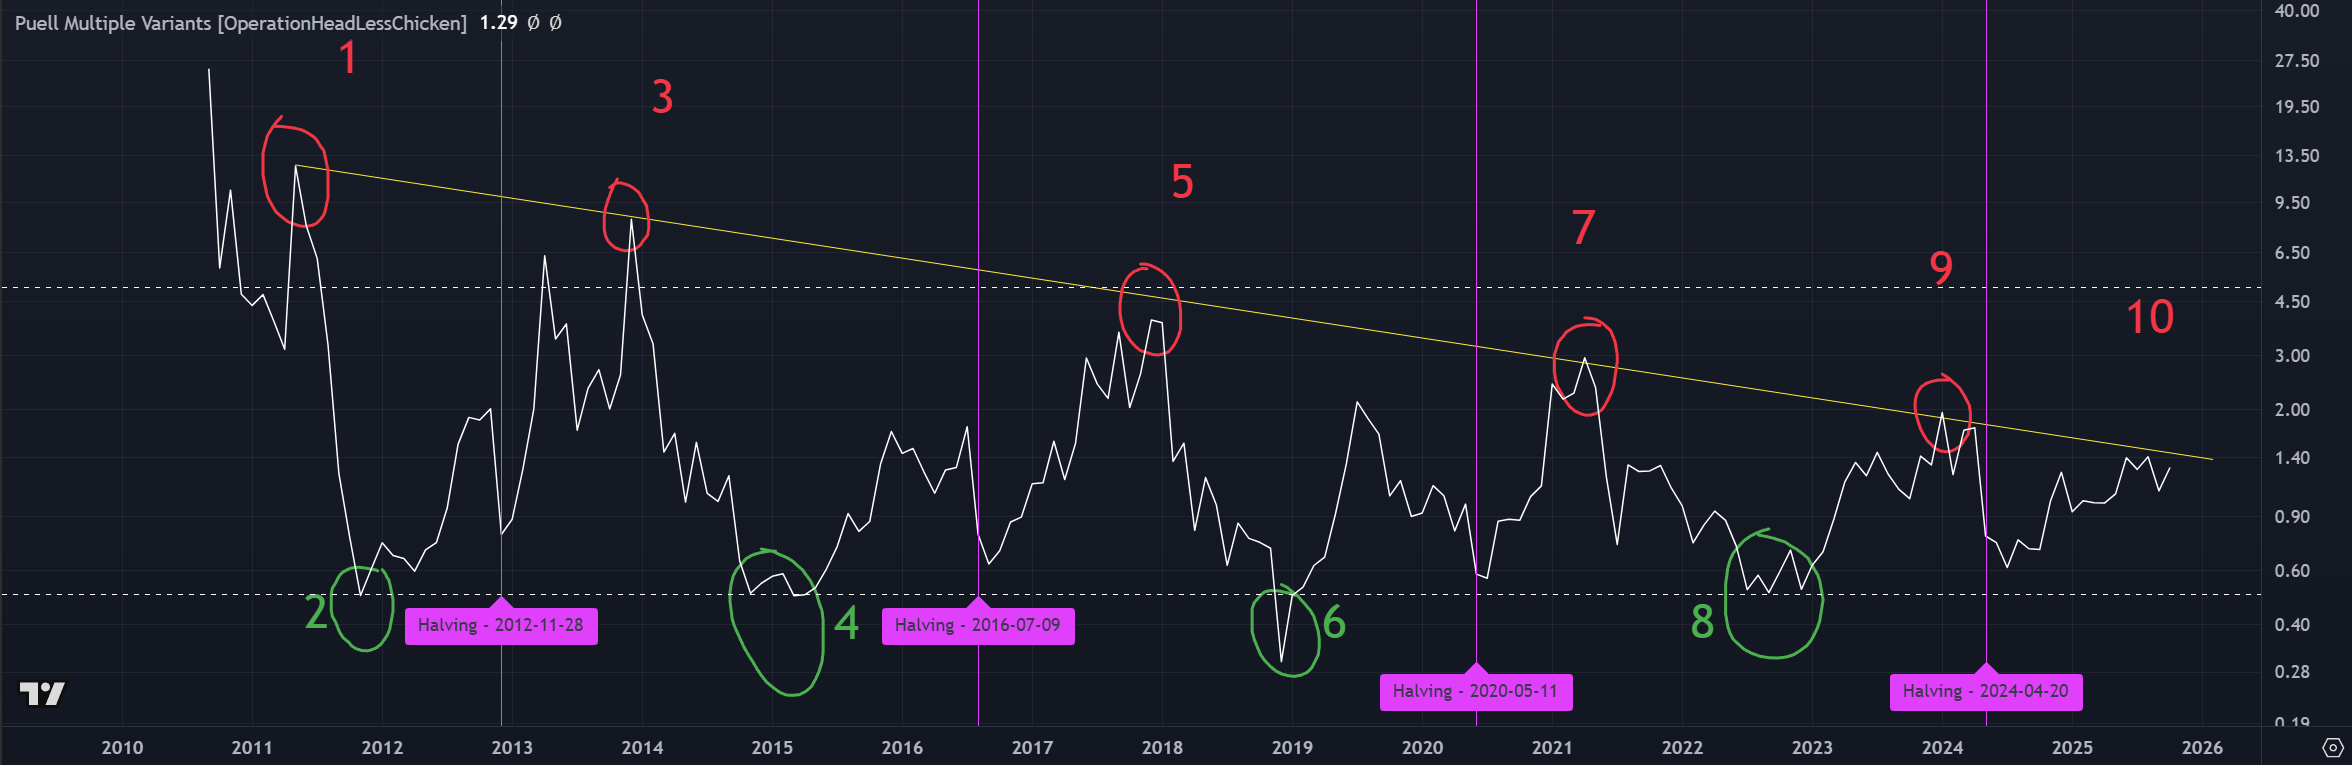
Figure 2: Puell Multiple and halving events
*: The logarithmic scale allows me to draw a straight trend line instead of a 1/(2^k) exponential decay function. k is the number of halvings in the past. Every halving cuts the miner rewards in half, so it will be 1/2, 1/4, 1/8… etc. of the initial block reward. I also use the monthly chart to reduce noise
In Figure 2, you can see how miner revenues and bitcoin halvings are closely related. The peaks in the Puell Multiple marked with 1,3,5,7 indicate extreme high revenues. Historically, they have always followed a halving event (with the exception of 9, see later). As discussed earlier, halvings press down miner revenues, which is clearly visible as local bottoms right after the halvings (purple lines), but they cause a supply shortage in the longer term, which leads to subsequent peaks (1,3,5,7). Then the peaks in Puell Multiple have indicated overvalued market conditions which was followed by a reversal and has lead to the dreaded crypto bear markets, until BTC’s price (and thus miner revenues) bottomed (2,4,6,8).
Puell Multiple and Bitcoin’s price
Now let’s have a look at Bitcoin’s historical price in the context of the Puell Multiple indicator. Figures 3/a and 3/b show the same concept, the only difference is that in 3/a, BTC’s price is plotted on a logarithmic scale. This allows us to see the early price action better, while 3/b uses the linear scale to visualise the second half of BTC’s history better.
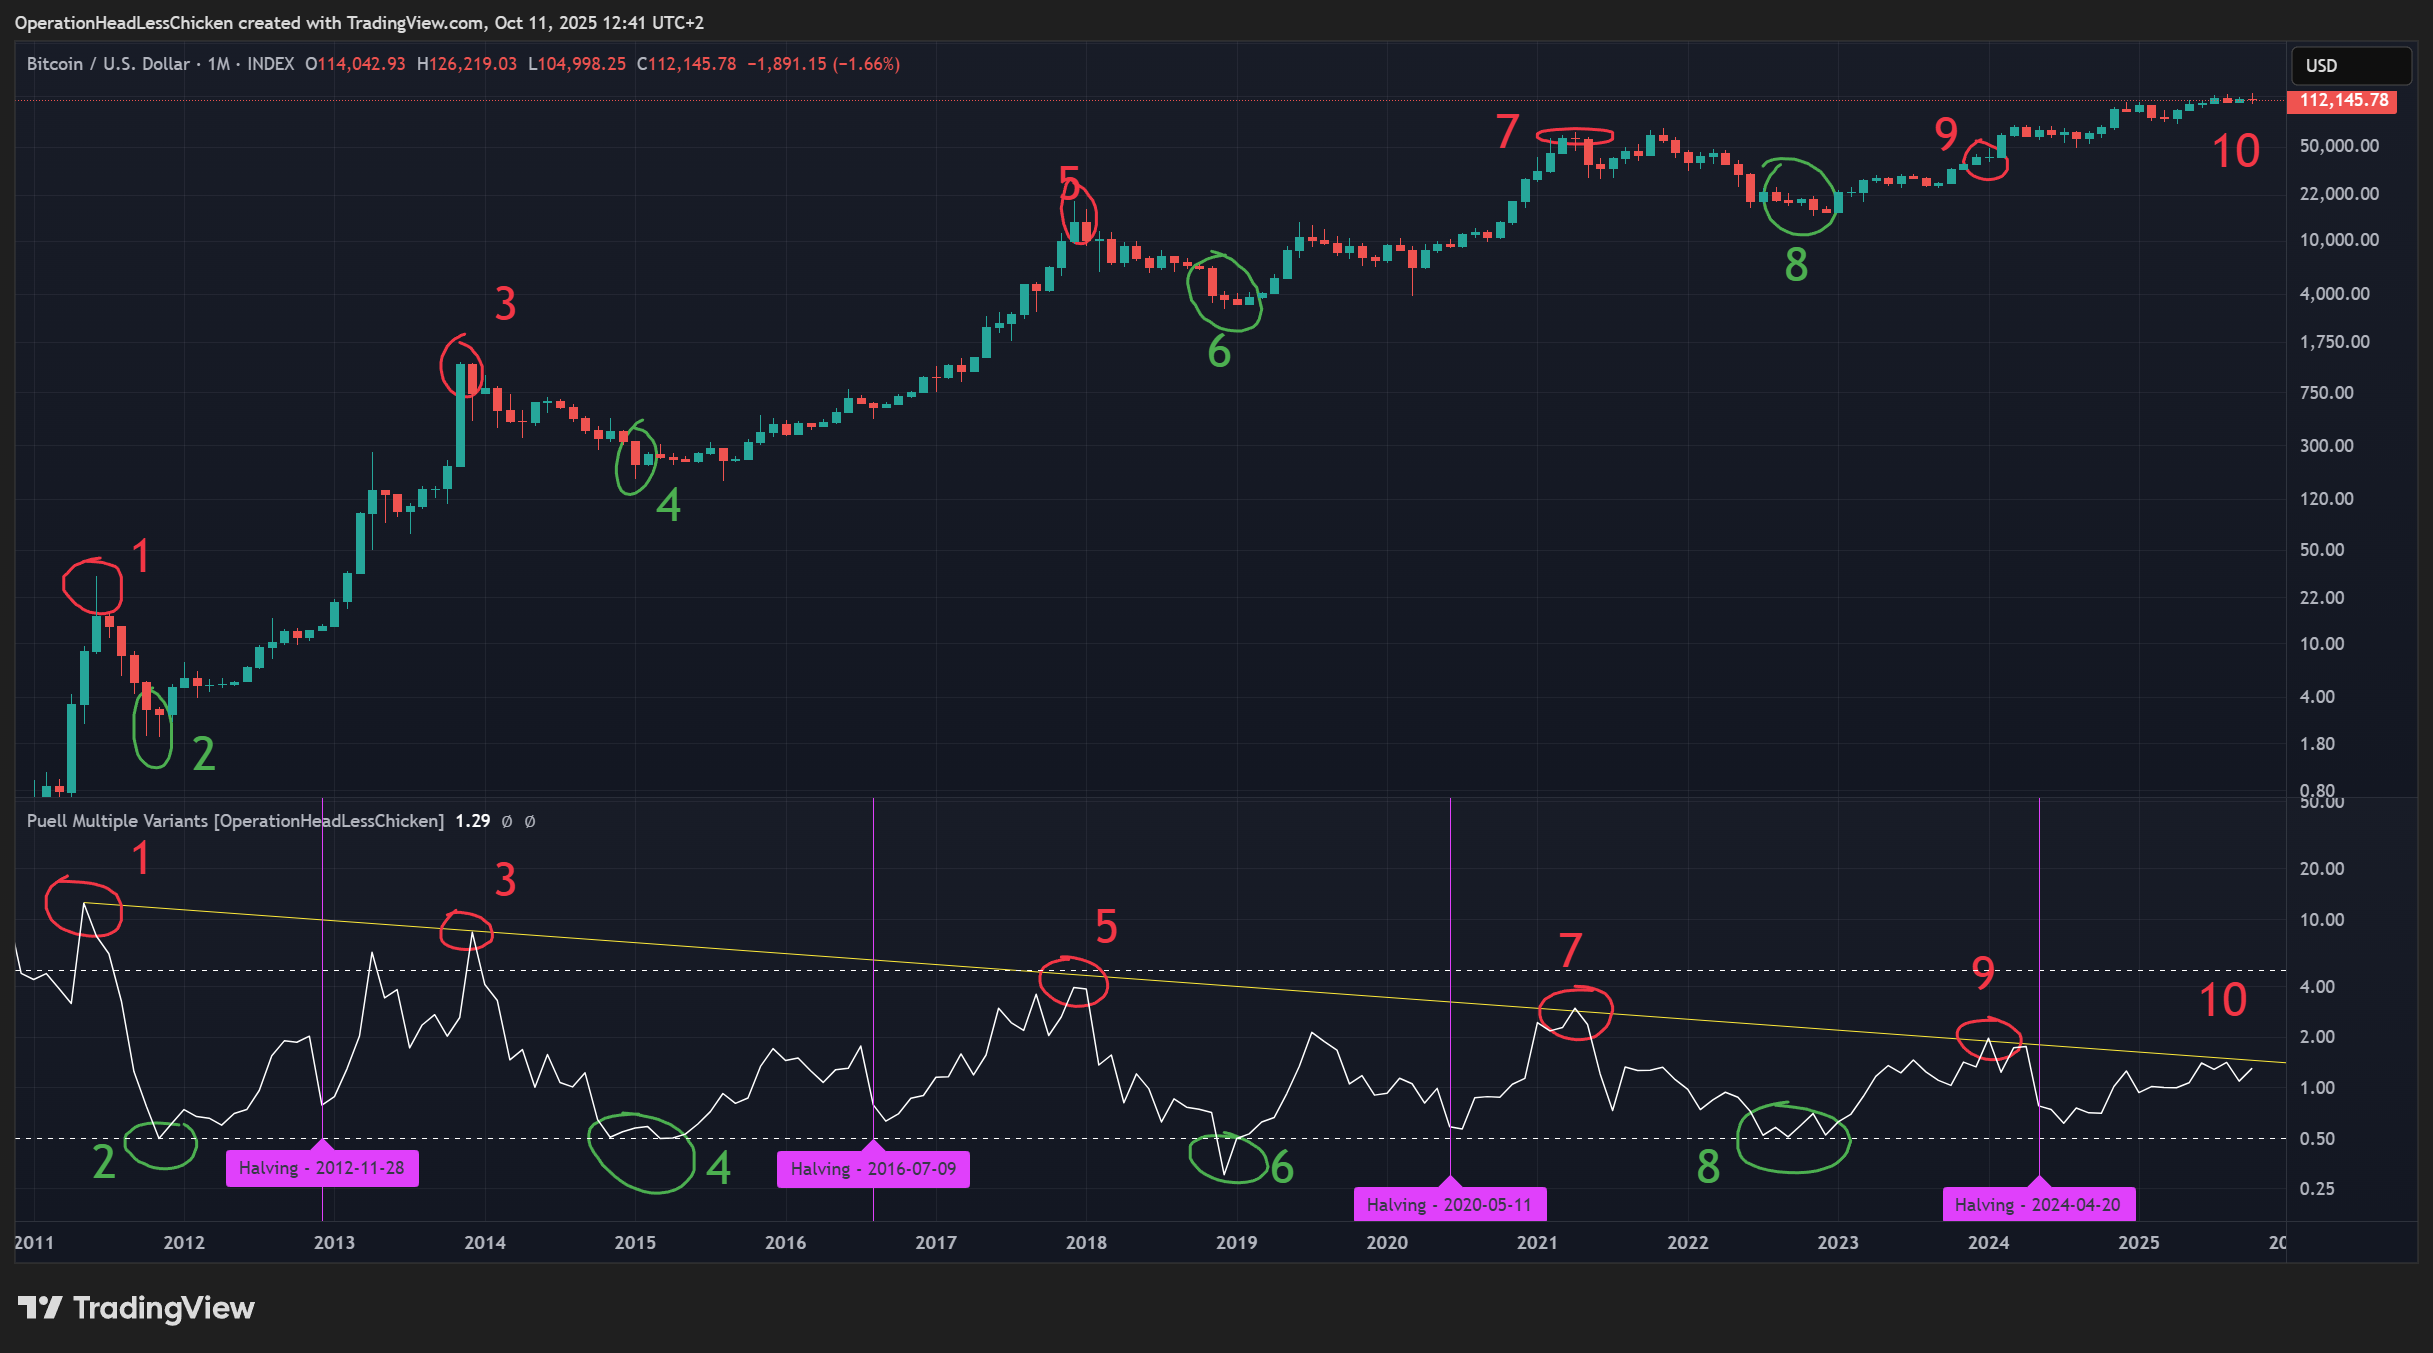
Figure 3/a: Puell Multiple and BTC price, logarithmic scale
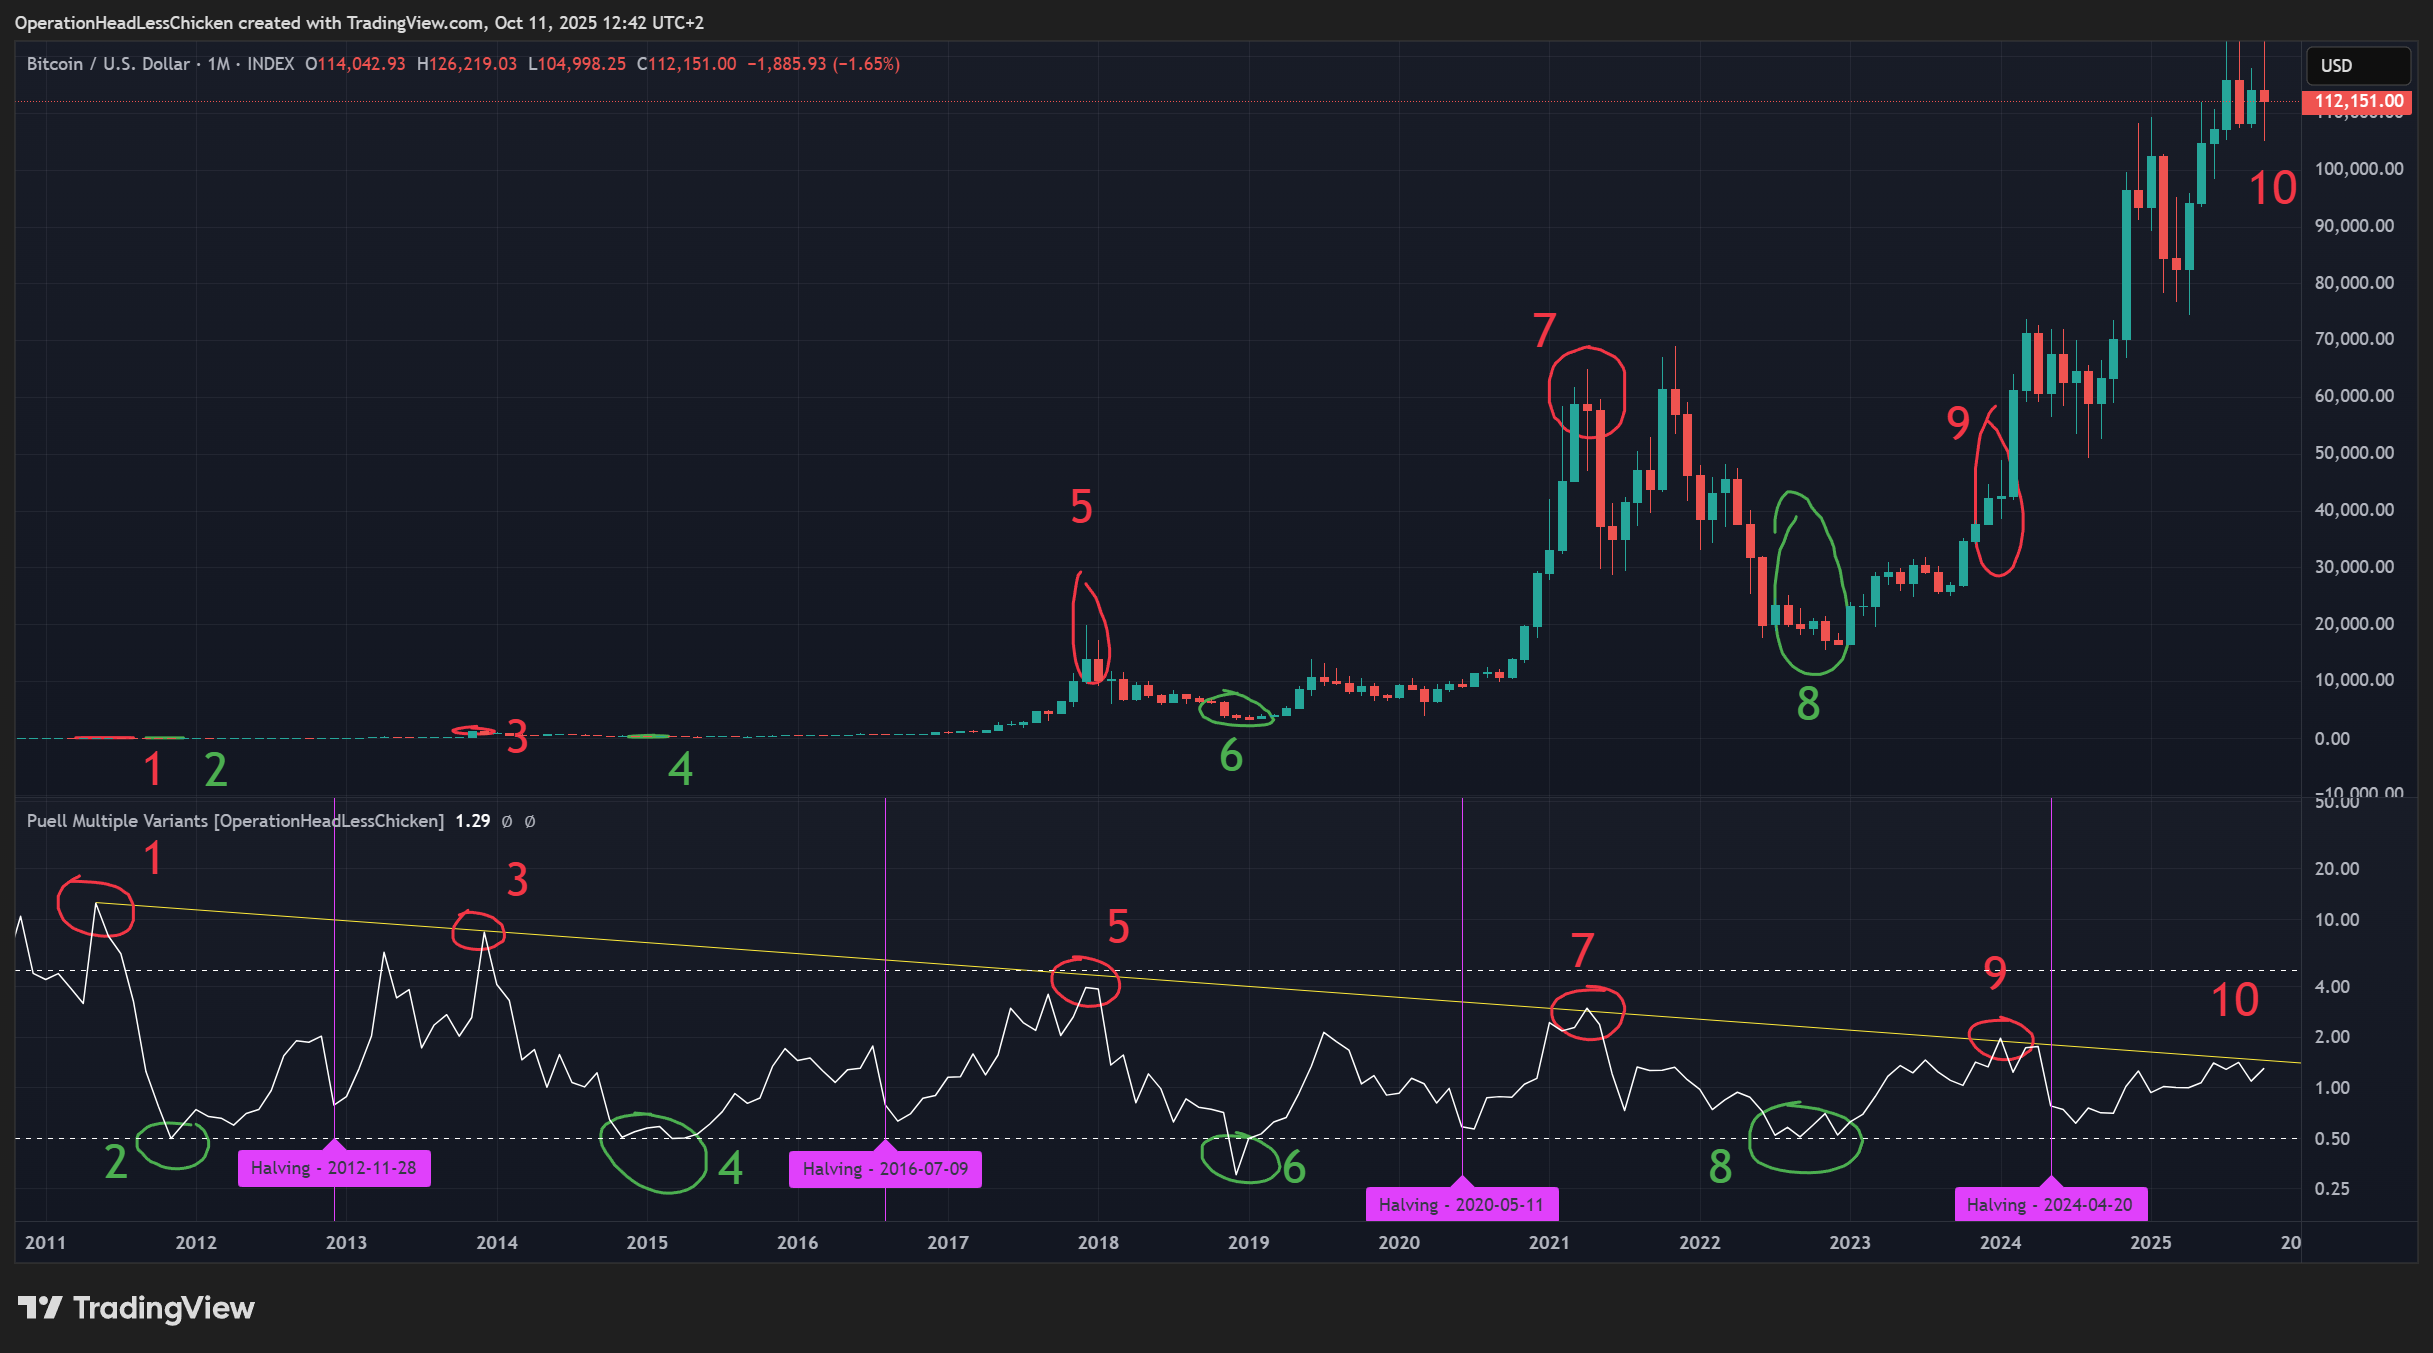
Figure 3/b: Puell Multiple and BTC price, linear scale
I have highlighted the values on the price chart that correspond to the occasions the Puell Multiple showed extreme revenue levels. As you can see, they have indicated market cycle tops and bottoms pretty accurately. There are two caveats, however:
- At
5, the Puell Multiple didn’t hit our downward trendline, even though it was a cycle top. If one relied solely on the Puell Multiple, they would have missed the selling opportunity. - At
9, the indicator did hit the trendline, although it wasn’t a cycle top. The cycle top has already happened earlier in April 2021, and we would expect the next one only after the next halving event, which happened in April 2024.
The big question
As you can see at 10, the indicator is approaching the trendline, and the Bitcoin cycle is also at a phase where we can expect a cycle top. The question is if we are really at the top? Is it happening soon? Or maybe we have already passed it similar to how 5 only approached the trendline, but never touched it?
Strengths
- The Puell Multiple has historically indicated cycle tops and bottoms pretty accurately.
- Especially market bottoms. When it reached
0.5, it has proven to signal good buying opportunities - With a little bit of extra consideration (timing in the Bitcoin cycle) it also indicated cycle tops relatively well.
- Especially market bottoms. When it reached
- Has strong fundamentals. Even if the market is maturing and may start behave differently (see Weaknesses), miner profitability is always going to be a factor.
Weaknesses
- Some people don’t believe in the 4-year cycle any more, and that would question the usefulness and accuracy of the Puell Multiple as well. The reasons:
- ETFs and institutions: the crypto market is maturing as more and more institutional players enter, who represent a significant demand on the market. They may hoover up the dips
- Treasury companies: basically the same effect as above
- Even some miners are becoming treasuries themselves and decide to never sell
- Historical behaviour doesn’t guarantee future success. It is not specific to the Puell Multiple, but any indicator
- This one is not a problem with the Puell Multiple itself, but CoinMarketCap stated that
When the indicator reaches levels between 3.5 and 10, it enters what’s called the “red zone” – a territory that has often coincided with Bitcoin price peaks
This is true. A value of 3.5 has always been overvalued, and would certainly be today, but the problem is that the last time the Puell Multiple reached 3.5, was at the end of the 2017 bull run (5). Since then, peaks 7,9 and 10** are getting lower and lower. This made me thinking of other solutions, and while switching the chart to logarithmic scale and drawing a trendline seems to work, I have come up with some other approaches.
**: 10 is not a confirmed cycle or local top yet, but it is a higher value compared to the previous ones, so it is worth mentioning
Experiments and improvements
If you have read up until this point, congratulations. You have all the necessary information to understand and apply the Puell Multiple in your trading/investing decisions. From now on, it will get a bit nerdy so I won’t resent if you quit here. However, if you are open to a bit of exploration and possibly unusual, new findings, you are more than welcome to stay with me.
Puell Multiple halving corrected
As we have seen earlier, the overvalued peaks of the Puell Multiple follow an $\frac{1}{2^k}$ like function, but CoinMarketCap wrote about a constant value at 3.5. This gave me the idea to compensate the BTC halvings by multiplying the Puell Multiple value by $2$ after each halving. It turned out to be an overcompensation, and the peaks (1,3,5,7) were rising heavily. After some experimentation I found an approximate value: 1.63 which brings the trendline to a horizontal position at 12.49 (see below).
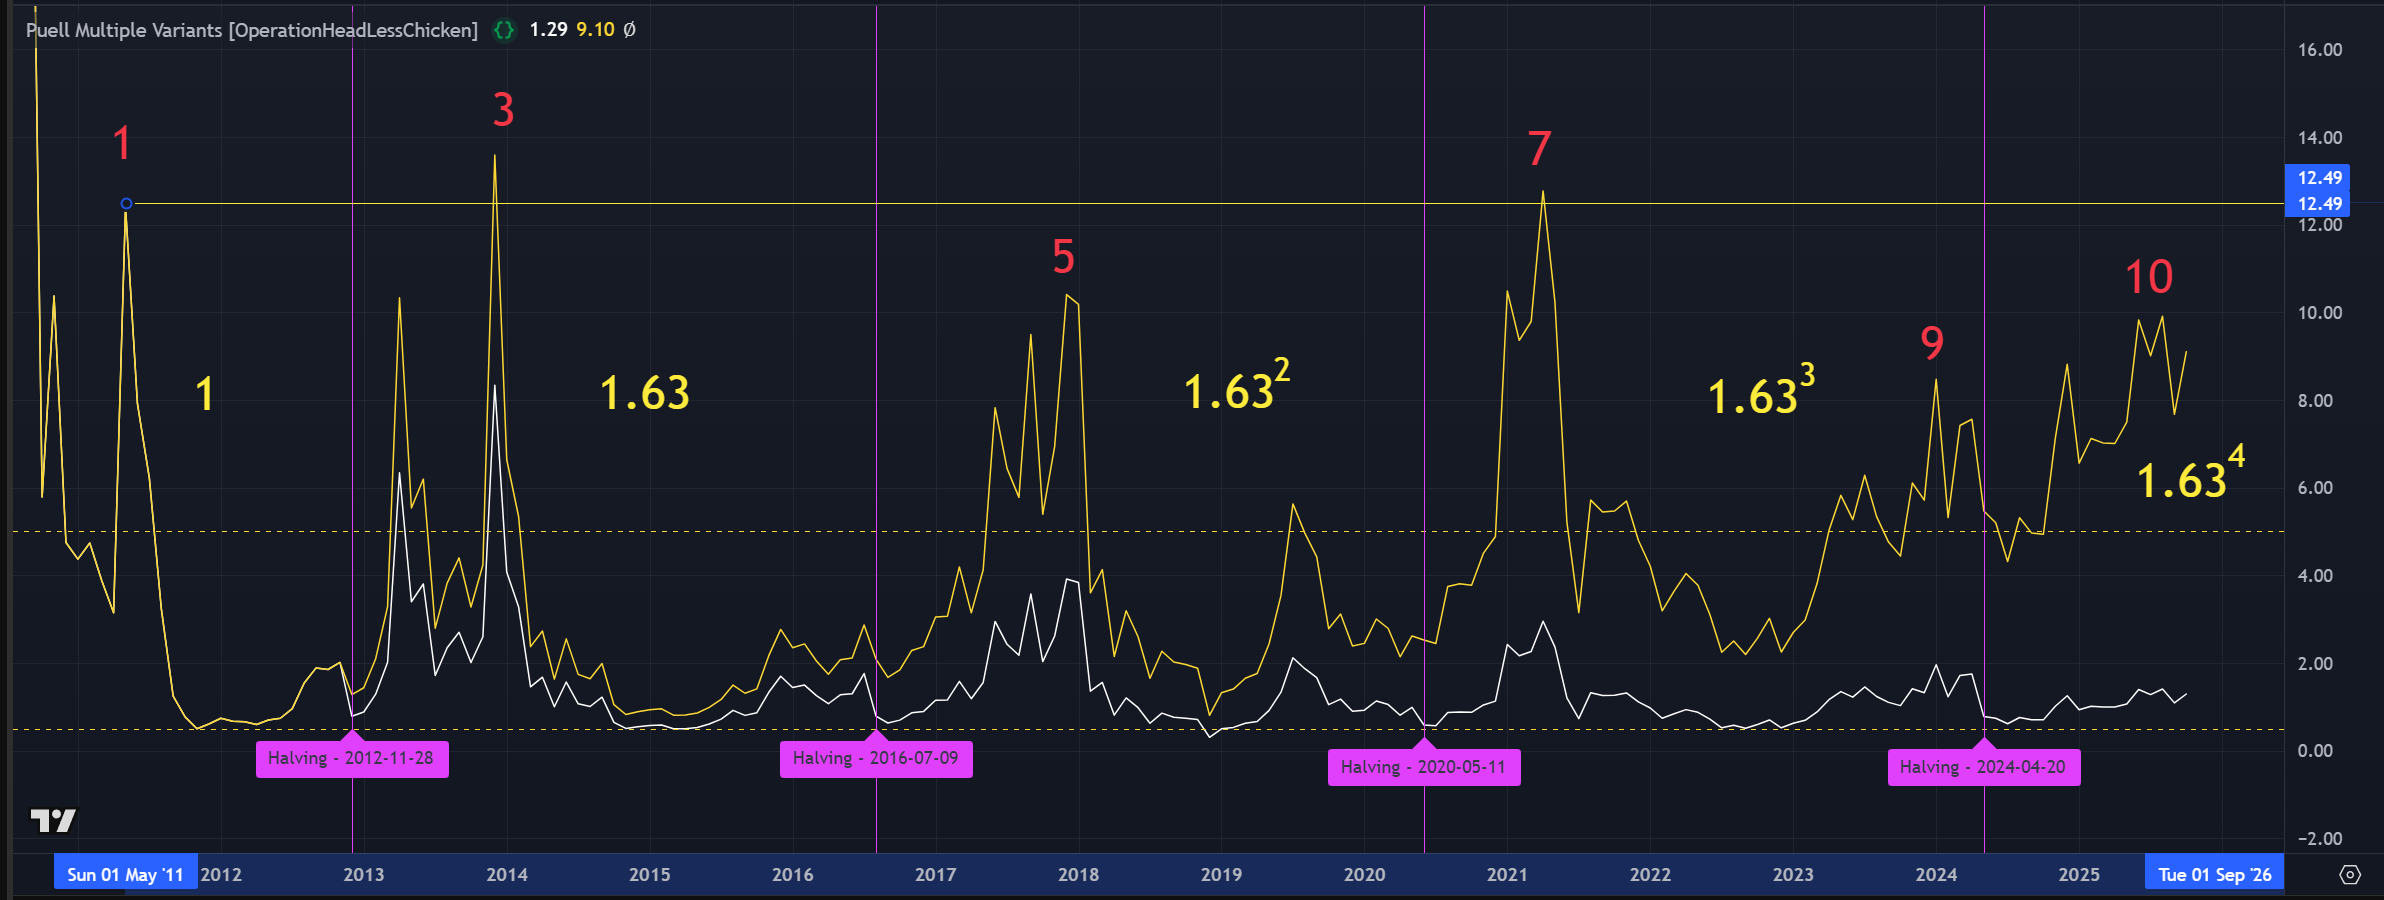
Figure 4: Puell Multiple compensated for BTC halvings
This means that in the long run, miner revenues are not cut in half by the halvings, but instead reduced to 61.34%. This makes sense, since the block reward are only one part of their income, the other part consists of transaction fees (as mentioned earlier), so miners’ lives are not so miserable after all. :)
In Figure 4, you can also see how the original Puell Multiplier (white) and the corrected one (yellow) relate to each other. Before the first halving, they are identical, since no compensation is needed. After each halving, the Original Puell Multiplier is multiplied by $1.63^k$, where k is the number of past halvings. After the most recent halving, it is $1.63^4 = 7.059$.
This representation makes it possible to assign a constant, horizontal value to the overvalued levels, but the drawback is that you lose the possibility to see the undervalued ones. Nevertheless, you have many months to switch between the two indicators if you wish. :)
It is also interesting to note that it seems like the current values at 10 still have some room before reaching overvalued territory. However, they are very close to the values of 5, which didn’t reach overvalued levels, despite being at a market top. Can we do something to improve this? See the next section!
Miner revenue Relative Strength Index (RSI)
Since we have been talking about over/undervalued levels, the Relative Strength Index (RSI) seems like a natural fit for our needs. Let’s see how we can apply it.
The RSI is usually applied to the price of something to determine over/undervalued conditions, but it can be applied to any timeseries. In this experiment, I applied it directly to miner revenue, and not the Puell Multiple.
Advantages
- It normalises data between 0 and 100, which means that
- We can apply it to the miner revenue directly, no need for additional normalisation by the 365-day moving average
- We don’t have to think about the diminishing nature of the revenue function
- It allows us to determine over/undervalued levels easily
- Very intuitive when plotted
After some experimentation, this is what I have come up with:
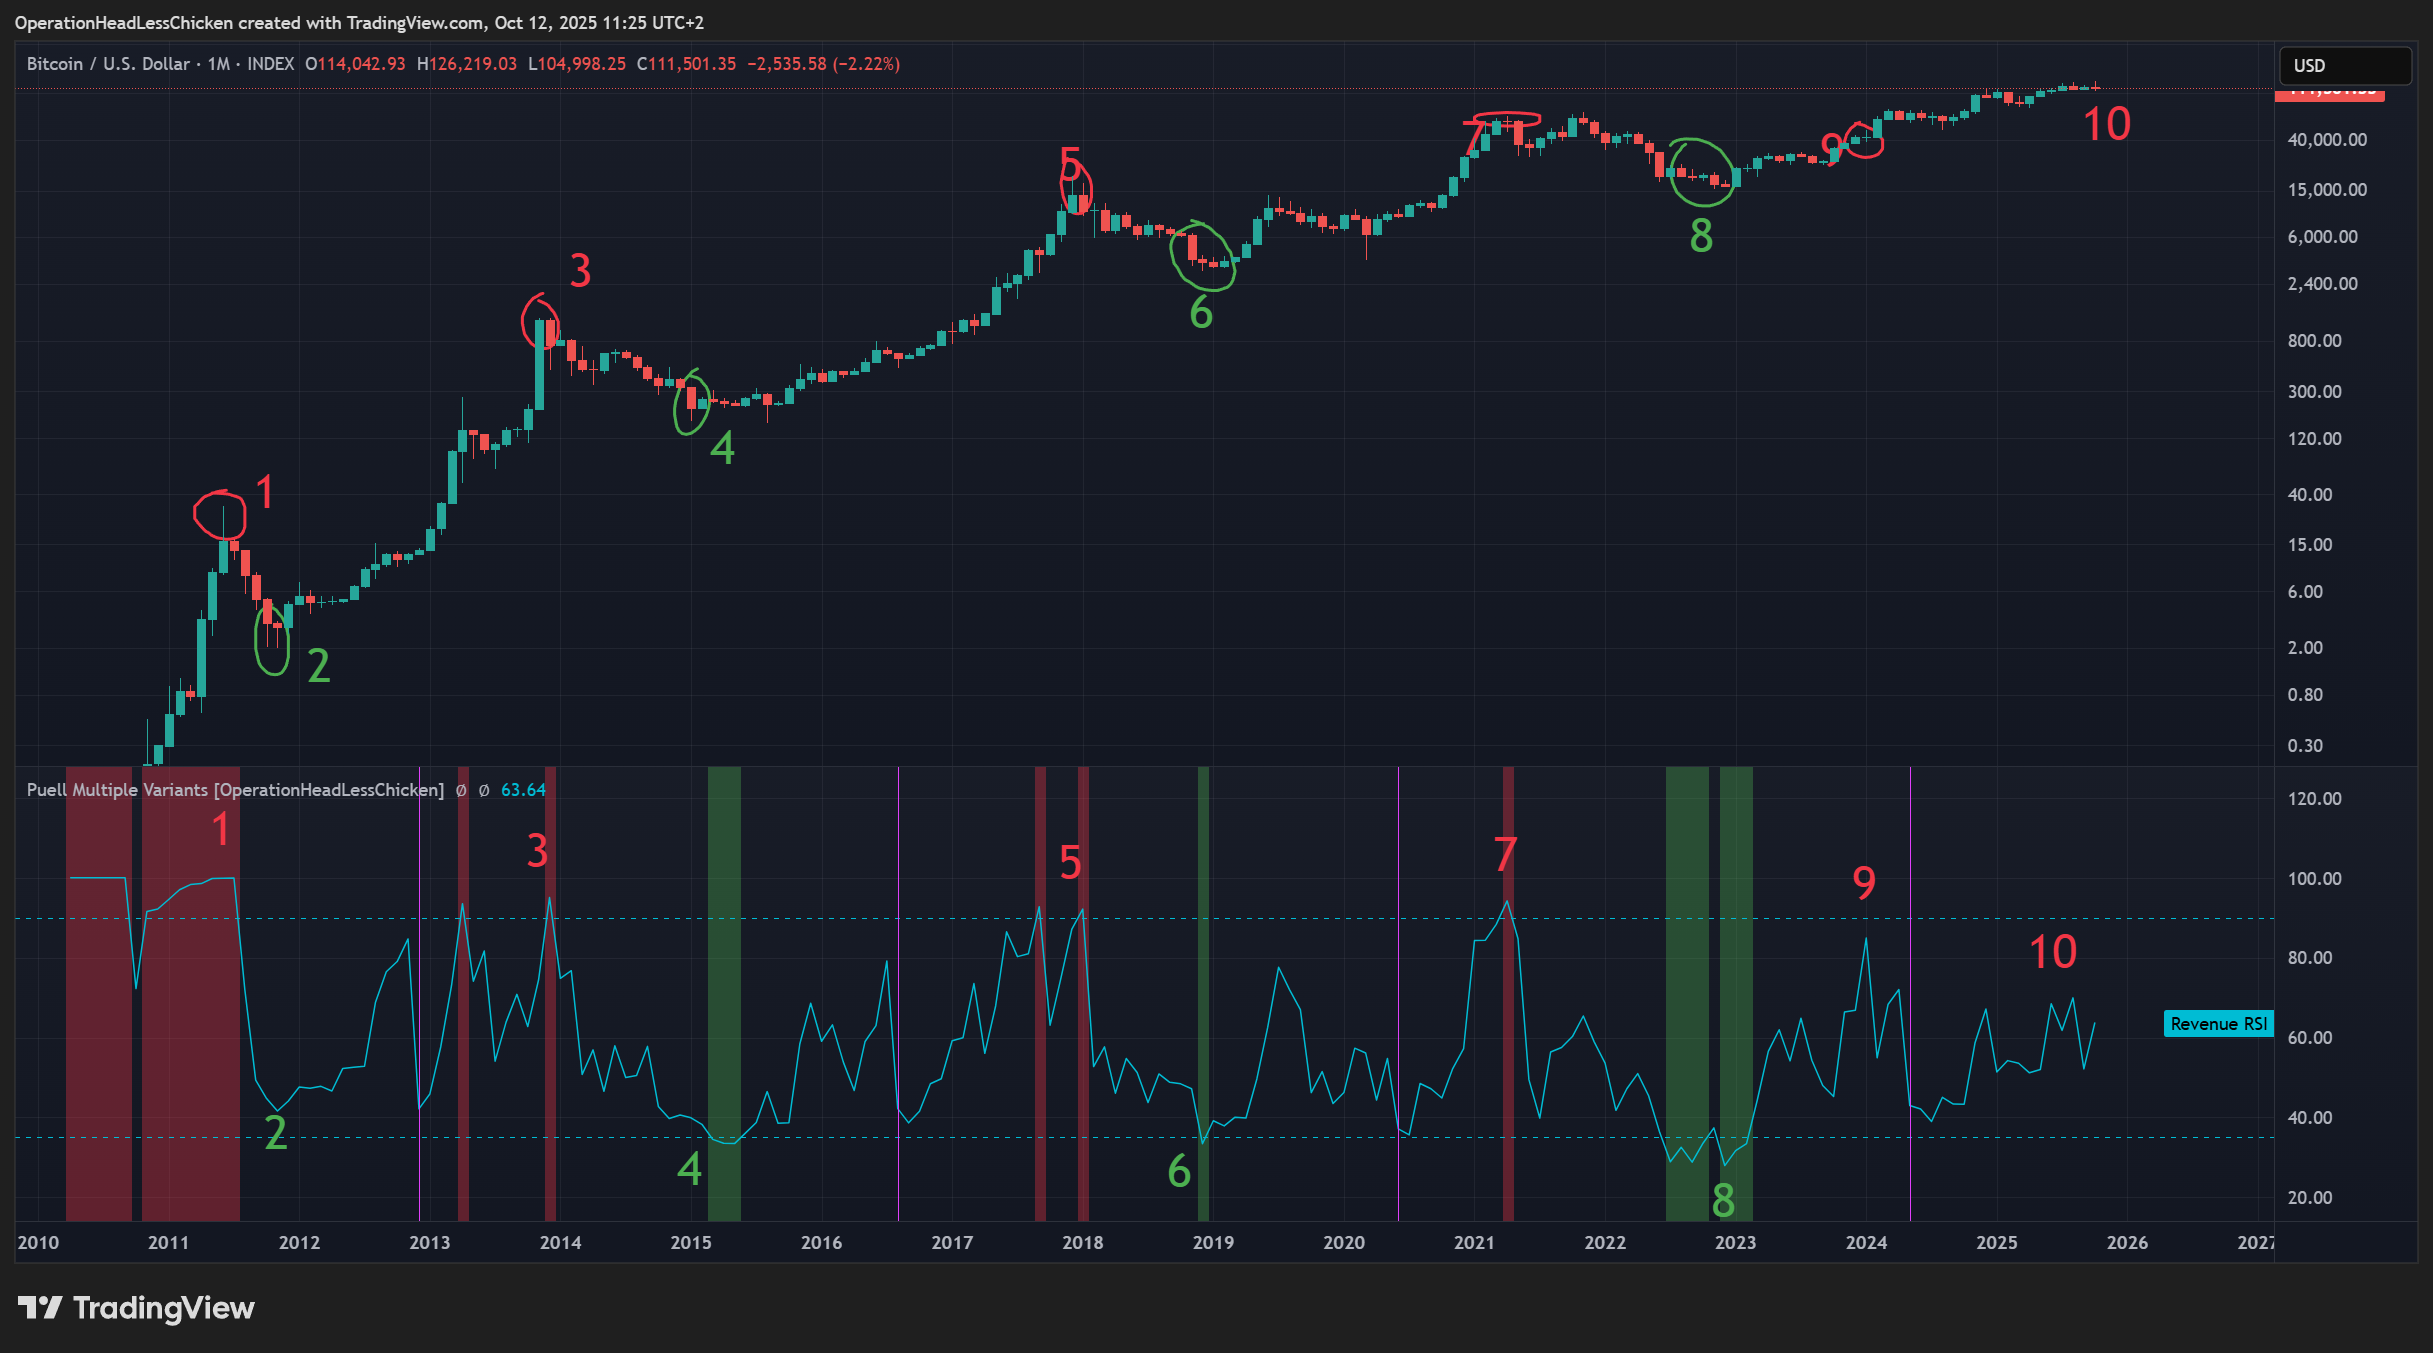
Figure 5: Miner revenue RSI
An RSI period of 6 gives a good result. It means that the RSI calculation takes the last 6 months into account. This is short enough to “forget” that the previous extreme values were higher, but long enough to detect current extreme values.
I have set the overvalued level to 90 and the undervalued to 35. These values signaled overvalued and undervalued conditions in the past pretty well. You can also see that the indicator highlights these areas with red and green backgrounds. This indicator looks quite good, but as always, besides its advantages, it has some caveats too:
Advantages
- Signals market cycle tops 1,3,5,7 very accurately
- It even marks 5 as a cycle top, which previous indicators weren’t able to do.
- Does not indicate 9 as overvalued
- Signals 4,6,8 as buying opportunities accurately
Caveats
- The indicator is admittedly backfitted
- The past data is quite limited (only 4 market tops and 4 market bottoms)
- Misses 2 as an undervalued opportunity
Observation: According to the Miner Revenue RSI, the current values at 10 are still far from overvalued.
Conclusion
In this blog post
- You could read about Bitcoin economy fundamentals, especially from the miners’ aspect who play a vital role.
- You could get familiar with the Puell Multiple which is a well established indicator and has given pretty accurate signals in the past.
- I have also pointed out some caveats and come up with two custom improvements that address those shortcomings:
- the
Corrected Puell Multipleand - the
Miner Revenue RSI.
- the
Custom indicators
It is important to note that there is a problem with custom indicators. If no-one else uses them besides you, they lack the self-fulfilling property that many popular indicators have. On the other hand, these are not completely new indicators, but different representations of the well known Puell Multiple, which make them potentially more useful.
TradingView indicator
I have made the TradingView indicator demonstrated in this post open source. Feel free to experiment with it and let me know your findings.
Final thoughts
This has been a deep dive on the Puell Multiple. A deeper one than I originally planned, but I feel it was interesting and worth it. I will continue the Crypto Market Indicator series with more indicators, but I will focus more on the market as a whole, and less on individual indicators. I feel this topic is timely, because many believe that we are close to a cycle top, so it is important to understand, prepare and have a plan for it. Stay tuned!
Glossary
- BTC: Bitcoin
- RSI: Relative Strength Index